Figures & data
Figure 1. Schematic diagram of MPCVD and SCD seed on a semi-open substrate of Mo.
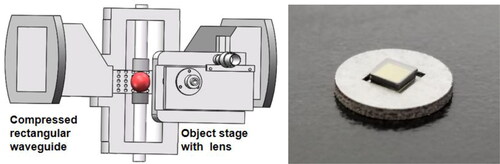
Figure 2. Optical microscopy images of as-grown SCD seed after polishing.
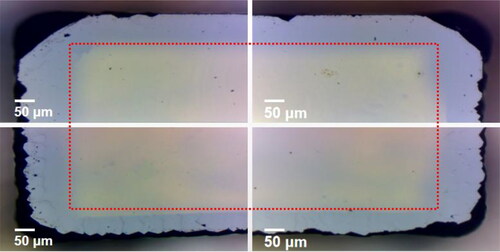
Figure 3. C2 (516.08 nm) radicals’ distribution along the substrate as a function of pressure.
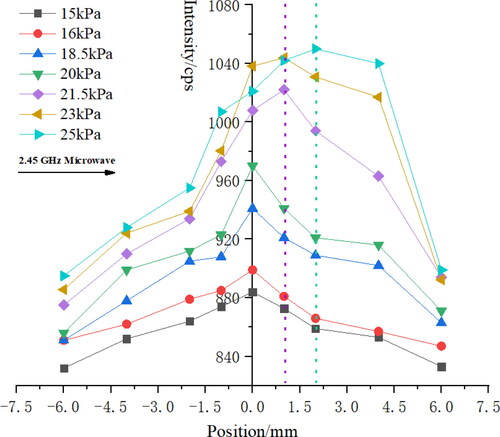
Figure 4. The plasma ball shifts from the center of seed and the emission spectra distribution of H2/CH4 (3 vol.%) plasma along the substrate at 23 kPa.
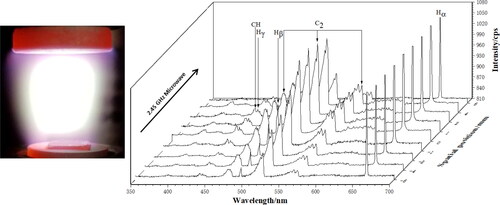
Figure 5. As-grown SCD samples under different pressure, (a) 20 kPa; (b) 21.5 kPa; and (c)23 kPa.
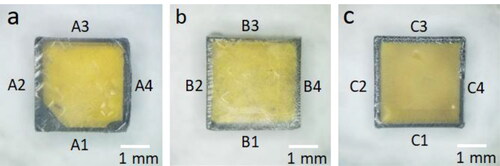
Figure 6. Optical microscopy images of as-grown SCD edge regions, (A1–A4) 20 kPa; (B1–B4) 21.5 kPa; (C1–C4) 23 kPa.
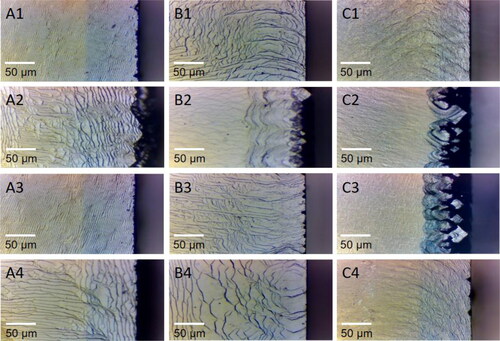
Figure 7. (a) Optical microscopy images of SCD sample on corners grown under 20 kPa. (b and c) Optical microscopy image viewed on the side of sample (a).
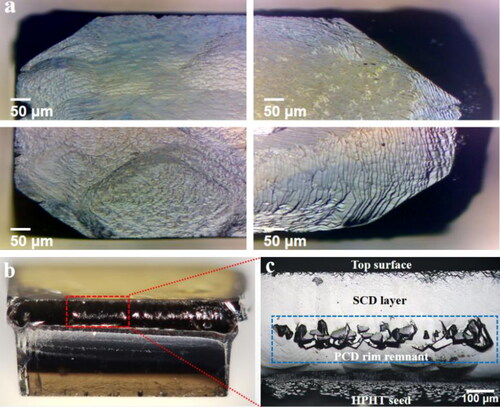
Table 1. Parameters for SCD growth.
Figure 8. Optical photograph of SCD lateral growth transition zone and the corresponding Raman spectrum, (a) 20 kPa; (b) 21.5 kPa; and (c) 23 kPa.
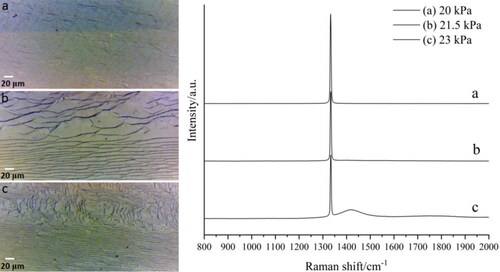
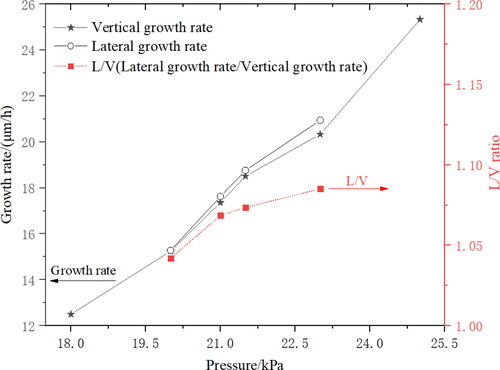
Figure 9. SCD epitaxial lateral growth rate as a function of pressure.