Figures & data
Figure 1. Characterization of the surface morphology and phase composition of BDD films. SEM images of H-BDD (a), O-BDD (b), OE-BDD (c), and the enlarged partial enlarged drawing of OE-BDD(d). The XRD (e) and Raman spectra (f) of electrodes.
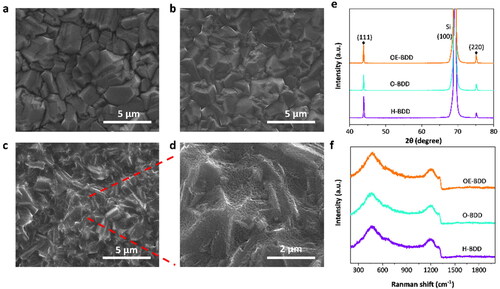
Figure 2. XPS spectra of (a) H-BDD, (b) O-BDD, and (c) OE-BDD. C 1s peak of XPS spectra of the (d) H-BDD, (e) O-BDD, and (f) OE-BDD.
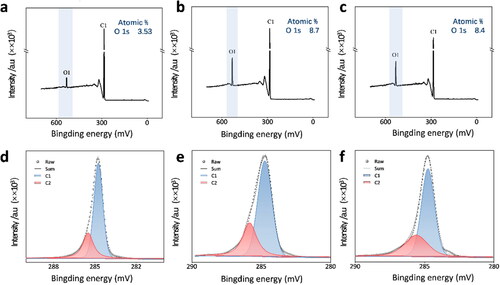
Figure 3. Histogram of the wetting angle of (a) H-BDD, (b) O-BDD, and (c) OE-BDD.
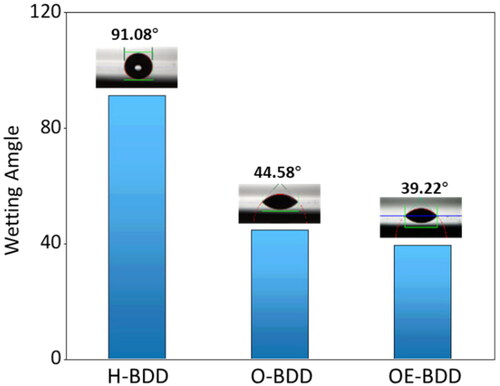
Figure 4. (a) CV curves of different BDD electrodes in 1 mM K3Fe(CN)6 + 0.1 M KCl solution at a scan rate of 20 mV s−1; (b) the column diagram of three electrodes to compare their kinetic parameters.
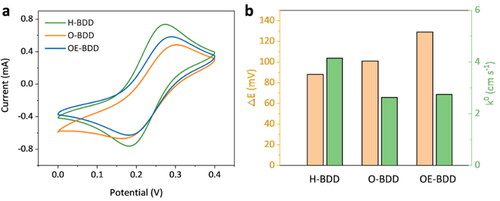
Figure 5. (a–c) CV diagram of electrodes in 1 mM K3Fe(CN)6 + 0.1 M KCl solution at different scan rates. (d) The relation between the oxidative peak current of three respective electrodes and the square root of scan rate, v1/2.
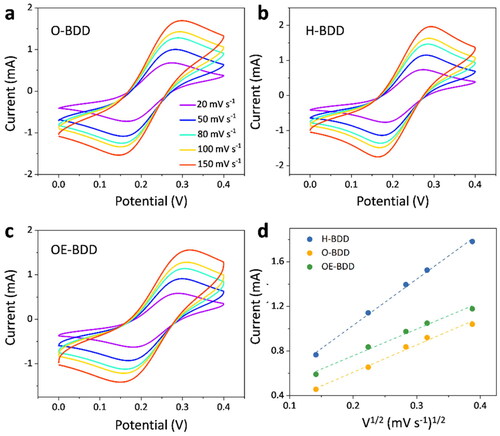
Figure 6. The plot of Ψ Versus [πDmvF/RT]1/2 for the reduction of 1 mmol K3Fe(CN)6 in 0.1 M KCl solution with three BDD electrodes.
![Figure 6. The plot of Ψ Versus [πDmvF/RT]1/2 for the reduction of 1 mmol K3Fe(CN)6 in 0.1 M KCl solution with three BDD electrodes.](/cms/asset/e5c6429a-09e3-4341-a4b0-850e51c41a36/tfdi_a_2078168_f0006_c.jpg)
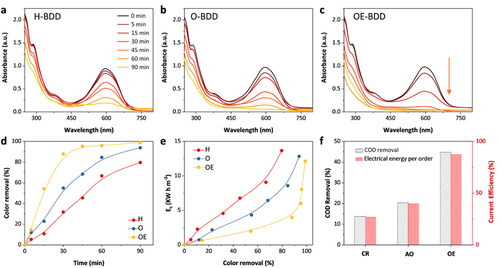
Figure 7. (a–c) The UV-Vis spectra of the three BDD electrodes for degradation of reactive blue 19 at different times. The degradation of RB-19 by the three BDD electrodes: (d) chromaticity removal rate with time, (e) energy consumption versus COD removal rate, and (f) COD removal rate plot versus current efficiency plot for the degradation of RB-19 by three BDD electrodes.