Figures & data
Figure 1. (a) Example UPS spectrum taken from a quarter monolayer of Ti on oxidised diamond, showing the additional large secondary-electron emission peak component at ∼16 eV indicative of NEA. Following convention, the plot begins at 21.2 eV, the photon energy of the He–I UV light source, and ends at the Fermi level, EF = 0. (b) Inset illustrating how the secondary electron cut-off (SECO) is obtained by extrapolation of the linear part of the plot to the axis. Thus, ϕ is given by 21.2 – SECO. (c) Inset illustrating how EVBM is obtained from linear extrapolation of the plot.
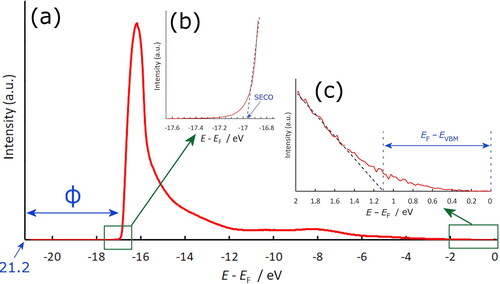
Table 1. Elemental surface composition derived from XPS for 3 different Ti coverages following oxidation at 20 °C, Ti deposition at 400 °C, and then following annealing at 3 higher temperatures (15 min each).
Figure 2. Percentage of the surface (a) O or (b) C atoms by area that are involved in different bonding arrangements after annealing at different temperatures for QML Ti deposition, obtained by analysis of the deconvoluted components of the core level XPS spectra. (a) Analysis of the O 1s peaks determines the O bonding in terms of ether (533 eV), ketone (532 eV), and metal oxide (531 eV) composition. (b) Analysis of the C 1s peaks determines the C bonding in terms of oxidation level (ether 288 eV and ketone 287 eV), C–C bonds (sp2 285 eV and sp3 284 eV) and two different metal–carbide bonds (283 eV and 282 eV).
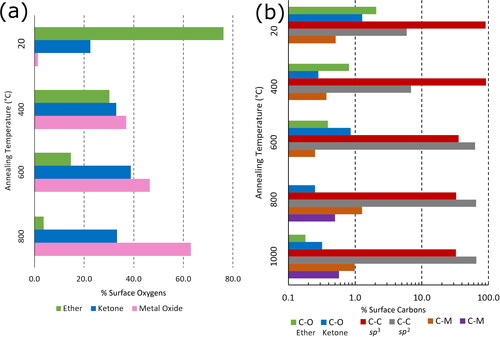
Figure 3. Variation with annealing temperature of (a) the work function, and (b) the electron affinity for the TiO-terminated diamond samples. The uncertainty in both ϕ and χ data values is ±0.15 eV.
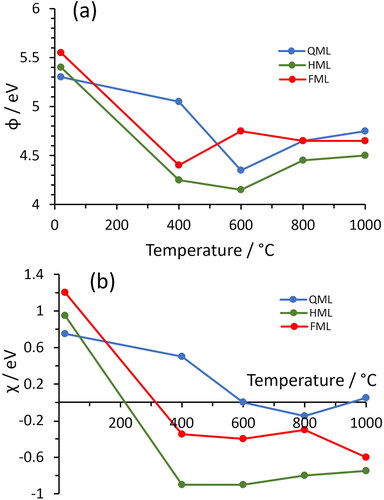
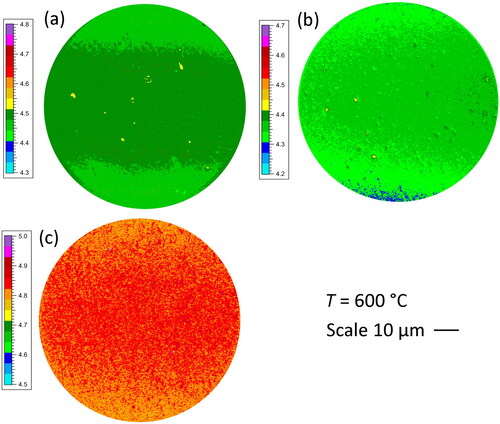
Figure 4. Work–function maps obtained by EF-PEEM for (a) QML, (b) HML, and (c) FML of Ti on oxidised diamond annealed at 600 °C.