Figures & data
Figure 1. Schematic illustration of diamond-based vertical-type SBPD.
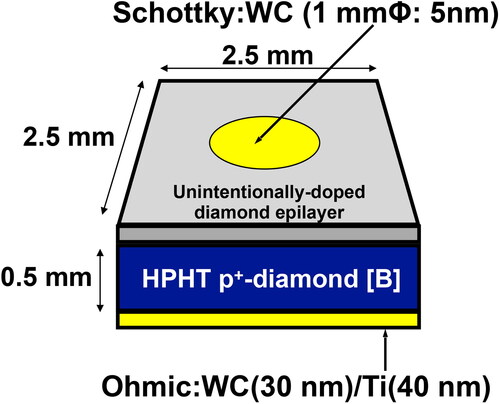
Figure 2. XRD profiles of diamond epilayer/p+-diamond substrate structure. (a) X-ray rocking curve and (b) 2θ-ω scan profiles of 004 diamond reflection.
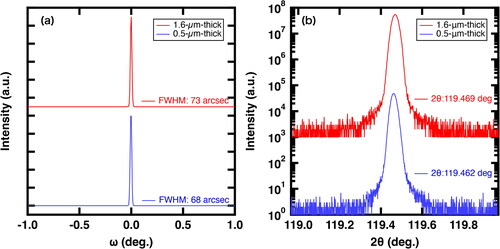
Figure 3. Raman spectra. Black, blue, and red lines correspond to the spectra of p+-diamond substrate, 0.5-μm thick diamond epilayer, and 1.6-μm thick diamond epilayer, respectively.
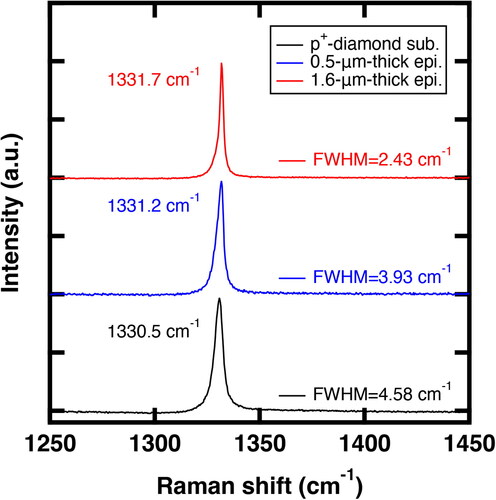
Figure 4. I-V characteristics of diamond-based vertical-type SBPD. Black and violet open circles correspond to dark and 220-nm DUV light illumination characteristics, respectively. The inset shows the equivalent circuit used for the fit. The solid line is the fitted curve.
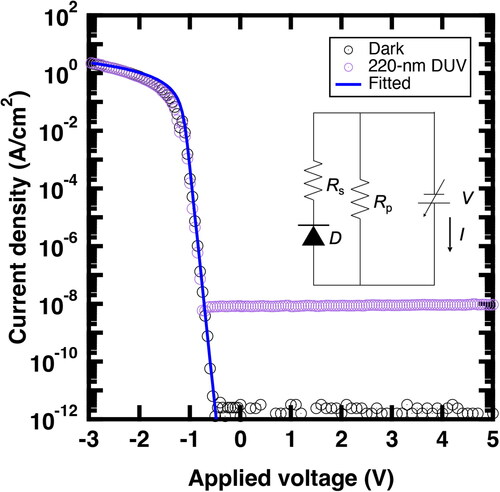
Figure 5. Spectral response characteristics. (a) Sensitivity as a function of wavelength, (b) response property, and (c) light angle dependence on the photocurrent.
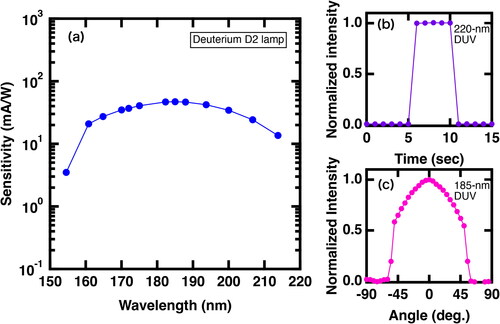
Figure 6. Stability evaluated by 172-nm xenon excimer lamp with 70 mW/cm2.
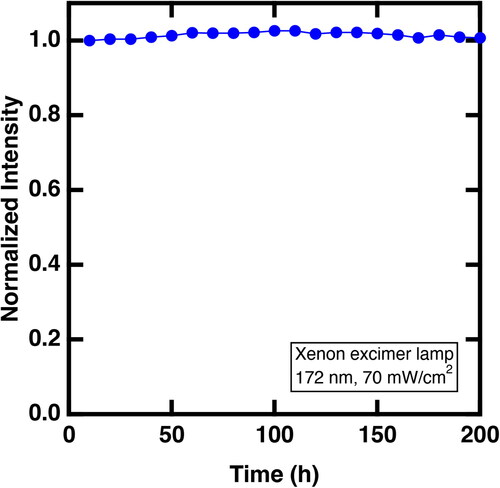
Figure 7. Response property and stability evaluated by 70 MeV protons. (a) Current generated by protons as a function of time and (b) normalized current intensity as a function of non-ionizing energy loss.
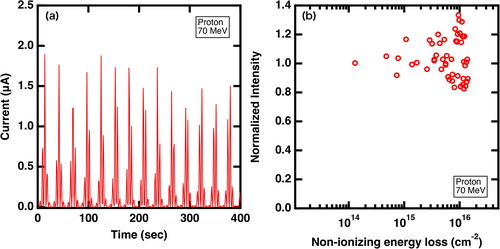
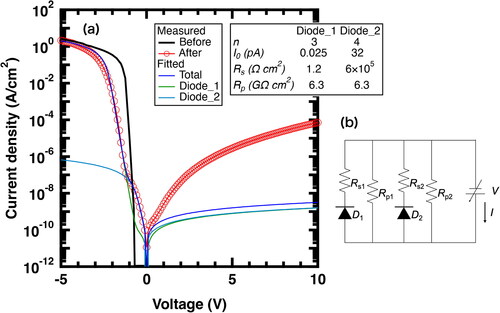
Figure 8. Dark I-V characteristics before and after irradiation of 70 MeV protons. (a) Measured and fitted I-V curves and (b) equivalent circuit used for the fit.