Figures & data
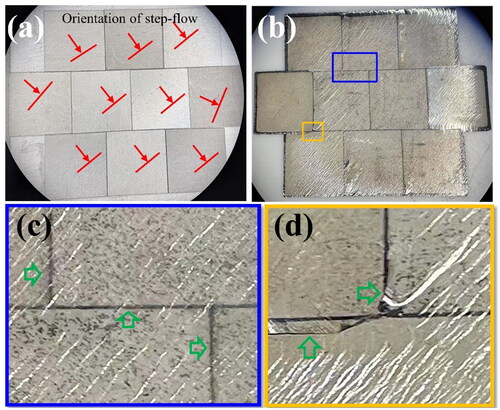
Figure 1. The OM image of the mosaic sample at center region (a). (b)∼(e) are the enlarged images of the boundaries. The red lines and arrows marked the orientation of the step-flow.
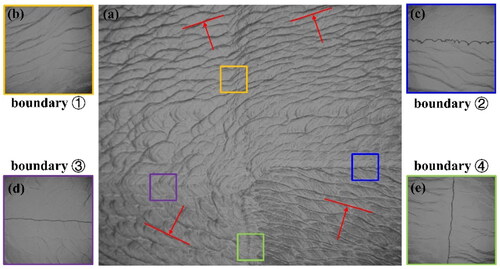
Figure 2. The PLM image of the cross-region of the mosaic sample with four boundaries.
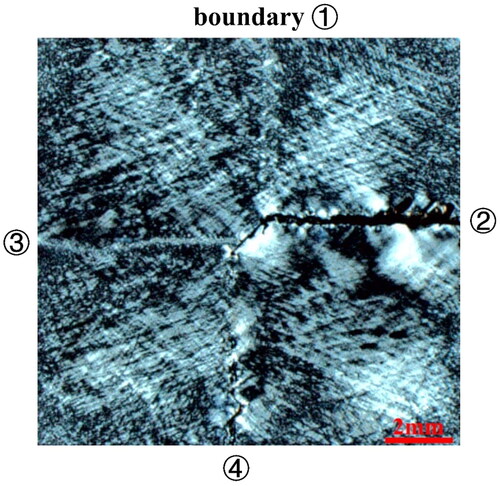
Figure 3. The schematic diagram of the 3D-CT scanning positions (a). (b)∼(d) are the CT images of mosaic SCD corresponding to line I ∼ III, respectively. (visual errors caused by the conductive adhesive are marked in the black circle).
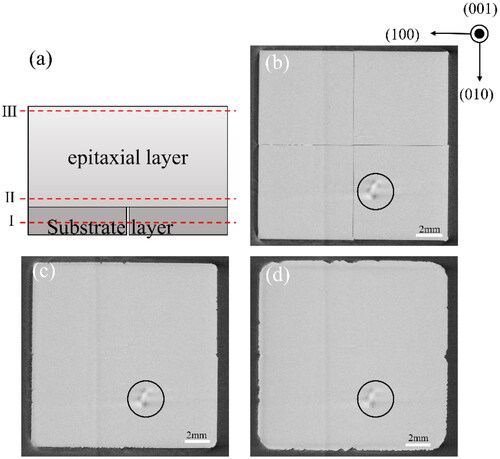
Figure 4. The cross-section SEM images of the boundary ① (a) and boundary ② (b) of the mosaic SCD. (c) and (d) are the enlarged images of the boundary ① and boundary ②, respectively.
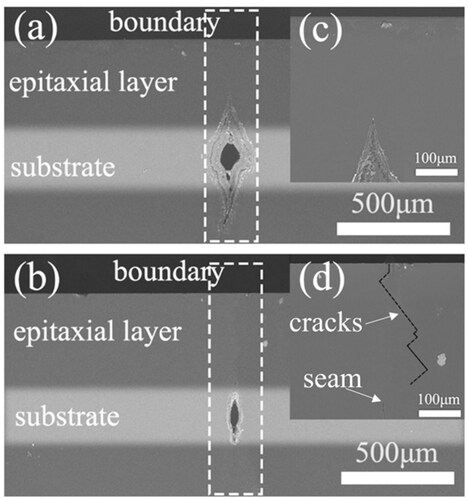
Figure 5. The schematic diagram of test points for the crystalline quality measurements of mosaic SCD (a). (b) and (c) are the IR spectra and Raman spectra of different test points. (d) is the deduced FWHM values.
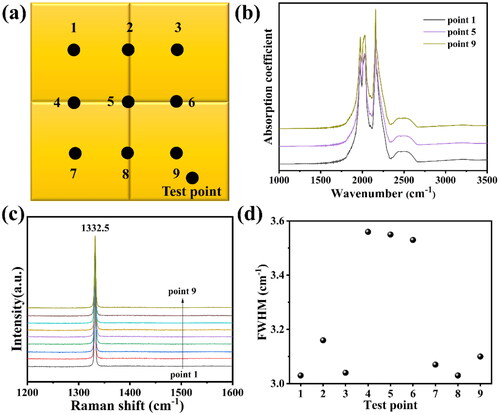
Figure 6. The Raman spectra of the boundary ① in mosaic SCD. (a) is the schematic diagram of the test positions. (b) is the typical Raman spectra recorded along line 1. (c) is the deduced Raman peak FWHM of line 1, line 2, and line 3.
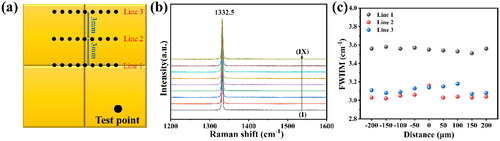
Figure 7. The typical PL spectra measured at different distances along line 1 for the mosaic SCD. The schematic test positions are the same as in . The variation of the intensity ratio of the NV0 zero phonon line (at 575 nm) and NV- phonon sideband (at 637 nm) is also plotted (b).
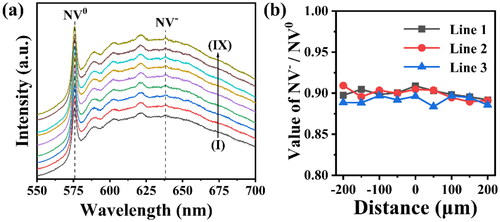
Figure 8. Raman mapping of the Central region of the mosaic sample with a test area of 2 mm × 2 mm covering the four boundaries. (a) is the image of the test area in the Raman microscopy. (b) and (c) are the FWHM and peak position of the first-order Raman peaks. (d) is the internal stress of the diamond calculated from the peak position shift.
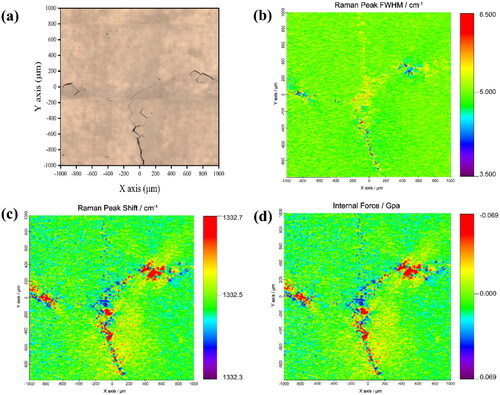
Figure 9. The OM image of inch-size mosaic SCD. (a) and (b) are the samples before growth, and after 24h growth, respectively. The red lines and arrows marked the orientation of the step-flow. (c) and (d) are enlarged images of the areas in blue and yellow boxes shown in (b), respectively. The green arrows marked the boundary morphology.