
Figures & data
Figure 1. Schematic illustration of the preparation process of the ND-PANI nanocomplex.
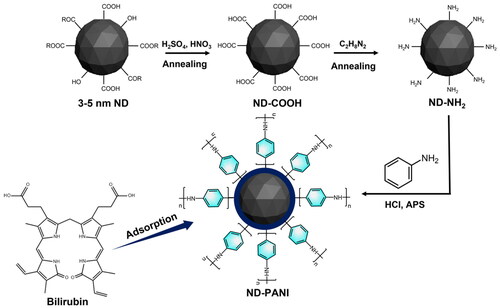
Figure 2. TEM image of (a) ND-NH2 and (b) ND-PANI. (c) HRTEM image of ND-PANI. (d) TG curves of ND-COOH, ND-NH2, and ND-PANI.
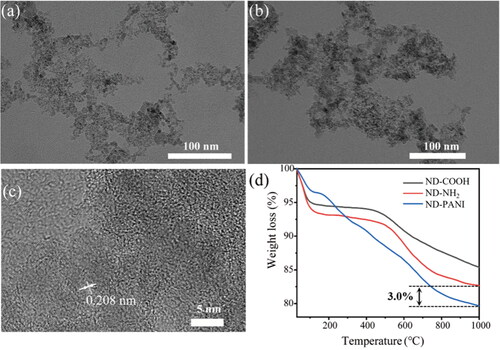
Figure 3. (a) XRD patterns of ND-PANI. (b) FT-IR spectra of ND-NH2, conventional PANI, and ND-PANI. (c) Hydrodynamic diameter distribution and (d) zeta potential of ND-COOH, ND-NH2, and ND-PANI.
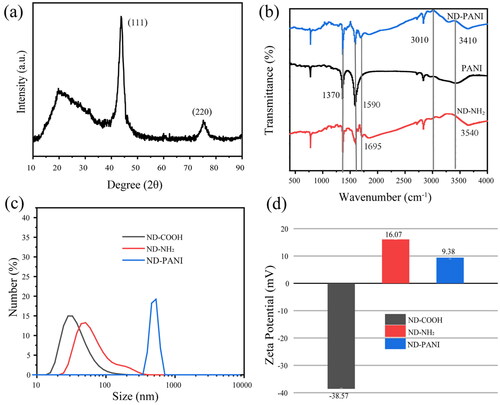
Figure 4. (a) Hemolysis ratio and hemolysis photographs of ND-PANI with different concentrations. (b) Absorption spectra of ND-PANI, bilirubin, and ND-PANI after bilirubin adsorption (ND-bilirubin). (c) changes in absorbance of bilirubin with different concentrations and (d) the corresponding fitted line plot.
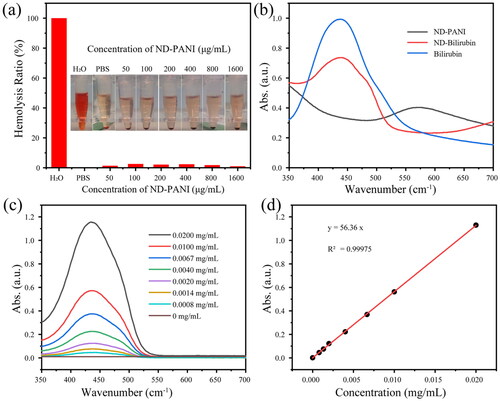
Figure 5. (a) The time-dependent adsorption of bilirubin in PBS solution. (b) Bilirubin removal efficiency with different initial concentrations. (c) The adsorption capacity of bilirubin bovine in BSA solution (40 mg/L).
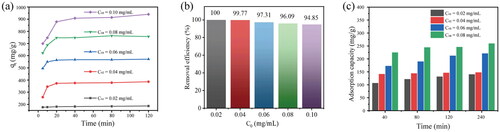
Figure 6. Kinetic studies of bilirubin adsorption on ND-PANI and the fitted curves by (a) pseudo-first and (b) pseudo-second models. (c) Bilirubin adsorption isotherms by ND-PANI and the curve fitted by Langmuir (dashed line), Freundlich (dotted line), and Liu (solid line) models.
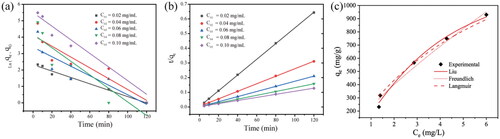
Table 1. Adsorption kinetic parameters of bilirubin by ND-PANI (C0= 0.1 mg/mL).
Table 2. Parameters of Langmuir, Freundlich and Liu adsorption isotherm models for bilirubin adsorption on ND-PANI.