Figures & data
Figure 1. FESEM images of BDD films with the deposited time of (a) 3 h, (b) 6 h, (c) 12 h, (d) 24 h.
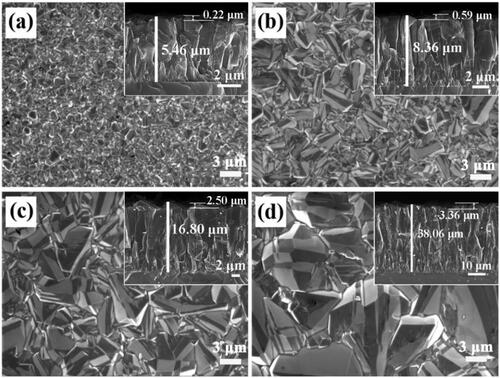
Figure 2. XRD spectra of BDD films for different deposition time: the black, red, blue, and magenta lines are the test results for 3, 6, 12, and 24 h sample, respectively.
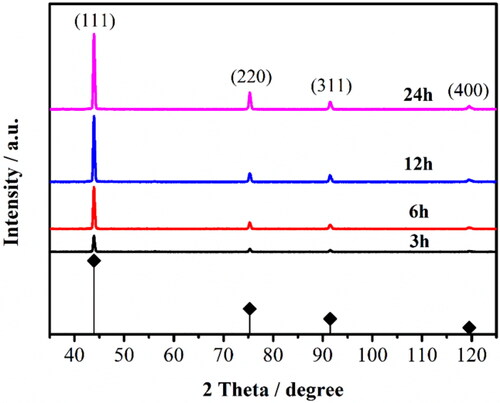
Figure 3. Deconvoluted XPS B1s spectra for (a) 3 h, (b) 6 h, (c) 12 h, (d) 24 h sample, respectively. The components are shown as follows: (1) B–B (185.92 eV), (2) B–C (187.1 eV).
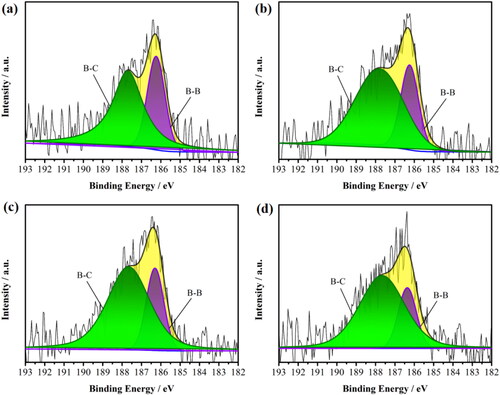
Figure 4. Confocal Raman mapping of BDD at different deposition times: (a–e) 3 h; (f–j) 6 h; (k–o) 12 h and (p–t) 24 h. Red, blue, and yellow represent sp3-C, B–C and B–B, respectively. (u) The statistics ratio of the sp3-C, B–C and B–B bonds area based on (b), (g), (i) and (q). (v) The statistics ratio of the B–B/B–C ratio.
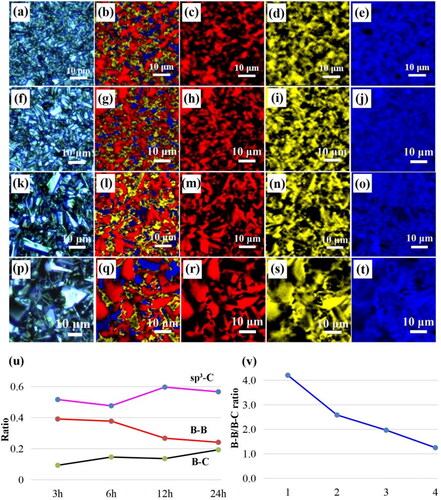
Figure 5. Raman spectra of BDD films at different deposition time: (a) 3 h, (b) 6 h, (c) 12 h, (d) 24 h. The insets are the Raman optical images, and the triangles, circles, and squares represented Raman spectral test locations. The black, red, and blue lines were the test results at triangles, circles, and squares locations, respectively. From the comparison of Raman intensity at square, circular, and triangle points, we can observe that the boron is mainly distributed in the incomplete crystal type region and grain boundary during BDD deposited process.
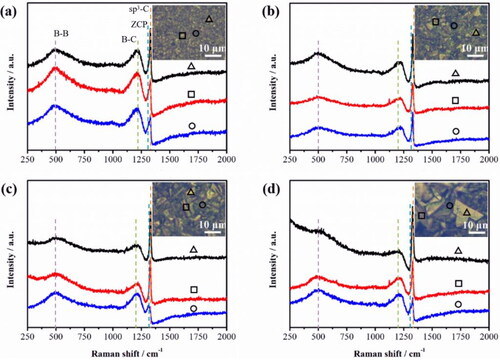
Figure 6. (a) The sheet concentration and sheet resistance pattern of the BDD films for different deposition time. (b) LSV curve of the BDD elecrodes at different deposition times. LSV was measured by 0.1 V/s in CO2 saturated 0.1 M KHCO3. (c) The double layer capacitance curve with different deposition time of the BDD electrodes. (d) Nyquist plots at a potential of −1.7 V (vs. Ag/AgCl) of the samples.
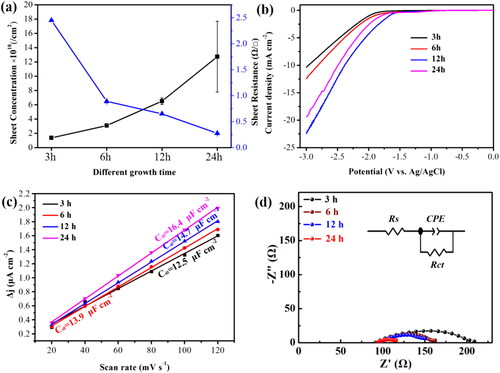
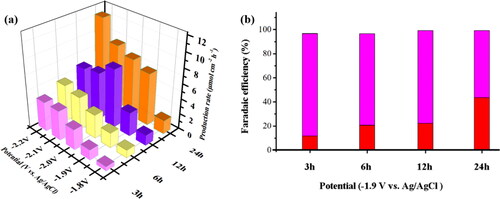
Figure 7. (a) The production rates of HCOO− obtained from electrochemical reduction of CO2 for 1 h at −1.8 to −2.2 V in 0.1 M KHCO3 by CO2 saturated 30 min. (b) FE for HCOOH (red) and hydrogen (magenta) production for electrochemical reduction of CO2 1h on different deposition times of the BDD electrodes at 3, 6, 12, and 24 h, respectively.