Figures & data
Figure 1. (a) AFM image, (b) SRWBT image, (c) CL images, and (d) processed Raman spectrum showing regular residual of the D-DFP-60.
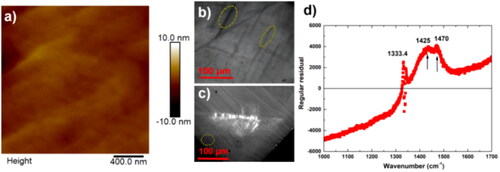
Figure 2. The cross-sectional DSAC-TEM image and amplified annular bright field (ABF) image of the subsurface damage of D-DFP-15.
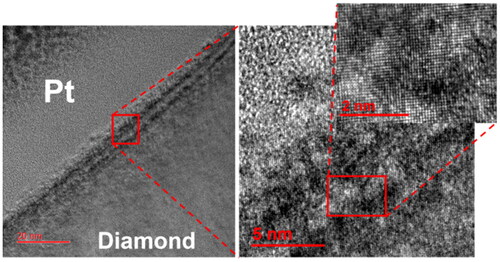
Figure 3. (a) The cross-sectional DSAC-TEM image together with an amplified annular dark field (ADF) inset of the subsurface damage of D-DFP-30, (b) EELS with an inset of enlarged spectrum features of the test point from the top polished surface to the bulk shown in (a).
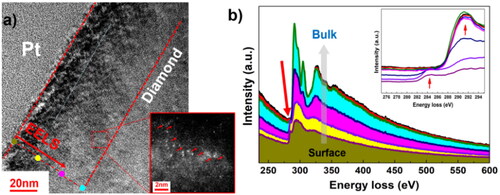
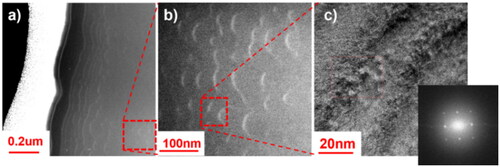
Figure 4. (a) DSAC-TEM-ADF image and (b) enlarged DSAC-TEM-ADF image of subsurface cleavages as well as the (c) DSAC-TEM-ABF image of defects regions of D-DFP-60 with an inset of electron diffraction pattern.