Figures & data
Figure 1. Schematic illustration of the possible modes for matrix ellipsometer processes of MCD films.
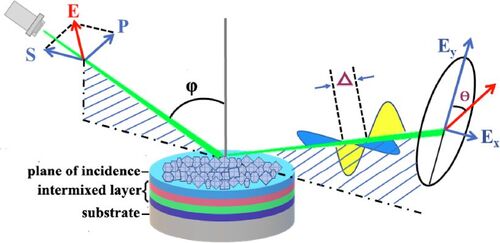
Figure 2. Experimental and fitted values of φ and Δ values for samples with Un-implanted, As-implanted, B-MCD-700, B-MCD-800 and B-MCD-900, respectively.
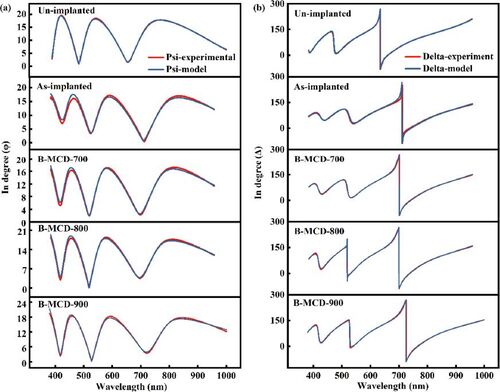
Figure 3. The variation of index of refraction (n) and extinction coefficient (k) with incident wavelength and photo energy for samples (a) Un-implanted, (b) As-implanted, (c) B-MCD-700, (d) B-MCD-800 and (e) B-MCD-900, respectively. FESEM micrographs and corresponding AFM three-dimensional stereographs of samples (f-F) Un-implanted, (g-G) As-implanted, (h-H) B-MCD-700, (i-I) B-MCD-800 and (j-J) B-MCD-900, respectively.
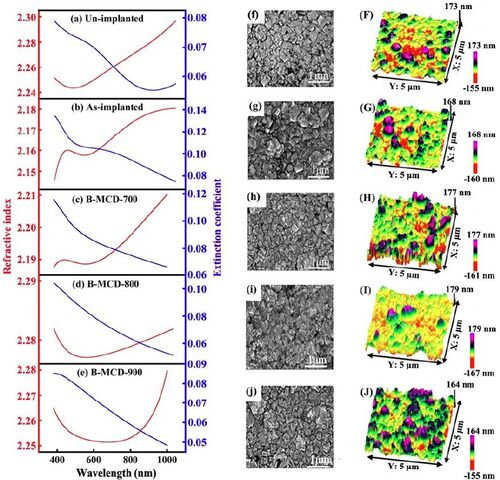
Table 1. The values of thickness, roughness and EMA from SE test fitting information and the data of Ra and Rq obtained from AFM.
Figure 4. (a) Typical visible Raman spectra from Un-implanted, As-implanted, B-MCD-700, B-MCD-800 and B-MCD-900 samples, (b) the ratio of ITPA/ISUM and ID/IG values, (c) the diamond peak position and its FWHM values, and (d) the G band position and its FWHM.
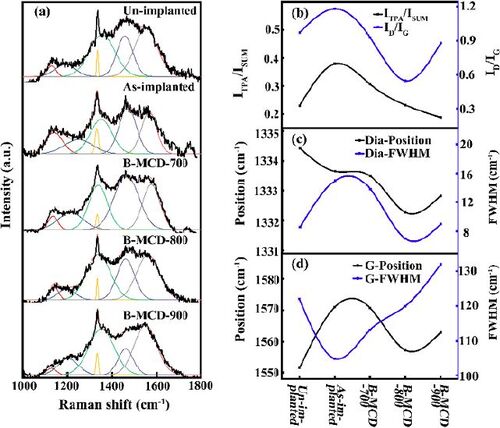
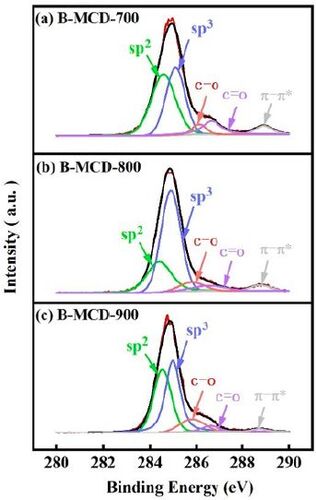
Figure 5. Typical C1s core-energy level spectra and boron ion implanted samples after annealing at different temperature.