Figures & data
Scheme 1. Detecting cellular radical responses of A549 cells upon incubation with ligands SST, TPP, and TAT. fND-NGs were first incubated with the cell to perform T1 relaxometry measurements and then low and high ligand concentrations were added to the ongoing T1 relaxometry measurements at 15 min and 75 min time points. τ indicates the waiting time of the laser pulses. Stage ① indicates the cellular intrinsic free radicals, and stage ②, ③ represent cellular radical responses upon treatment with low and high ligand concentrations, respectively.
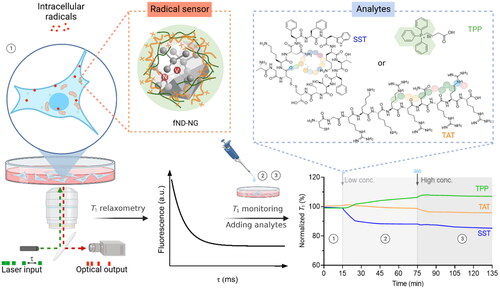
Figure 1. Characterization of fND-NGs. (a) Schematic structure of the fND-NGs shell. (b) ATR-FTIR of fNDs and fND-NGs. v: stretching vibration; δ: bending vibration. (c) Number–size histogram of fND-NGs measured by DLS. (d) Representative TEM images of fND-NGs. (e) Diameter histogram analysis of fND-NGs measured by TEM (n = 60).
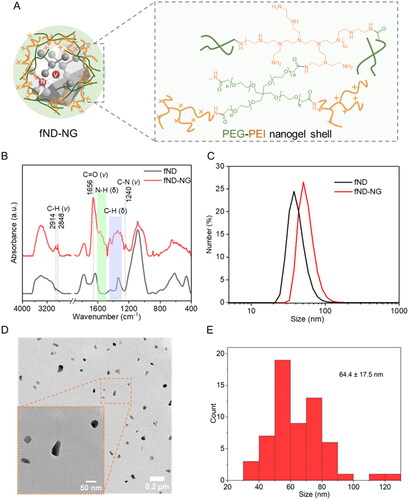
Figure 2. CLSM images of fND-NGs (red color) in A549 cells. fND-NGs were incubated with A549 cell lines for 24 h, then lysosomes were stained by Lyso-tracker (green color).
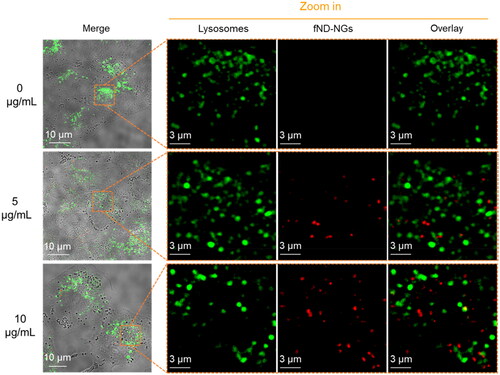
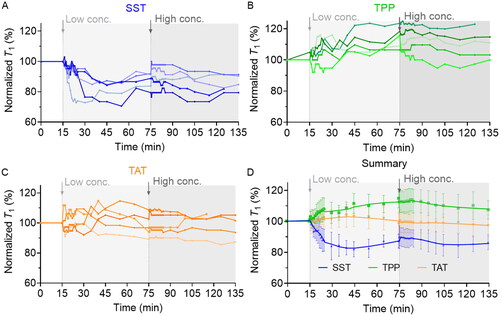
Figure 3. Cellular radical response to low and high concentrations of SST (a), TPP (b), and TAT (c) was measured by T1 relaxometry. Each curve represents an independent experiment on one isolated nanodiamond. (D) the general trend of cellular response to SST, TPP, and TAT treatment. The data is shown as mean ± SD (n = 5).