Figures & data
Figure 1. (a) The simulation model of nanocrystalline graphite featuring a 6.51 nm grain size and containing 214,224 atoms, with 16 randomly oriented grains arranged in a BCC lattice. The dotted golden lines indicate the grain boundaries. The simulation models of laminar perfect graphite containing 216,000 atoms, with (b) 30%, (c) 25% uniaxial pre-compression, and (d) no compression. The dashed blue rectangle represents the initial structure.
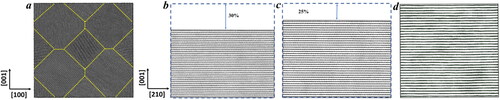
Figure 2. (a) The shear-stress − shear-strain relationship of the GB model during finite shear deformation at a strain rate of 0.001/ps. (b-f) Atomic configurations of GB models at various shear strains. Grains A, B, and C represent three representative grains. The color coding is based on the bond structures of atoms: grey for sp3 bonds, green for sp2 bonds, and tan for sp bonds. The blue dashed square indicates the rotation of graphite layers near the GB in grain C. The red solid square marks the initiation of the graphite to diamond transition, and the red dashed square represents the growth of diamond structures in grain A. Only one atomic layer along the y-axis is displayed for clearer illustration.
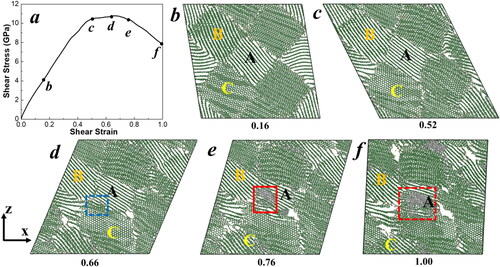
Figure 3. (a) The shear-stress − shear-strain relationship of the GB model during finite shear deformation at a strain rate of 0.1/ps. (b–f) Atomic configurations of GB models at various shear strains. Grains A, B, and C represent three representative grains. The color coding is based on the bond structures of atoms: grey for sp3 bonds, green for sp2 bonds, and tan for sp bonds. The blue solid square indicates the rotation of graphite layers near the GB in grain C. The red solid square marks the initiation of the graphite to diamond transition, and the red dashed square represents the growth of diamond structures in grain A. Only one atomic layer along the y-axis is displayed for clearer illustration.
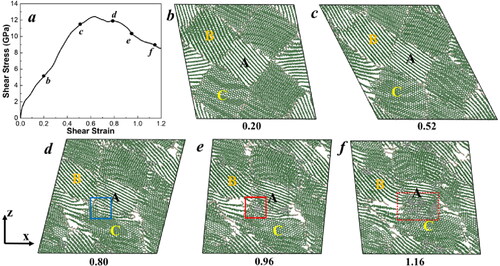
Figure 4. (a) Shear-stress–shear-strain relationship of the 1 nm × 1 nm × 1 nm cube in the diamond formation region (indicated by a red square). (b–f) snapshots of the triple junction region of grains A, B, and C. (g) Magnified structure showing the diamond structure from (f). Only one atomic layer is displayed for clearer illustration. The color coding of the atoms is based on their bond states: grey for sp3 bonds, green for sp2 bonds, and tan for sp bonds. The color coding of the diamond formation in the cube, inserted at the upper right corner, is identified by the diamond structure identification tool [Citation39] in the OVITO visualization package [Citation40]: blue for cubic diamond, light blue for the nearest neighbor of cubic diamond, orange for hexagonal diamond, and yellow for the nearest neighbor of hexagonal diamond.
![Figure 4. (a) Shear-stress–shear-strain relationship of the 1 nm × 1 nm × 1 nm cube in the diamond formation region (indicated by a red square). (b–f) snapshots of the triple junction region of grains A, B, and C. (g) Magnified structure showing the diamond structure from (f). Only one atomic layer is displayed for clearer illustration. The color coding of the atoms is based on their bond states: grey for sp3 bonds, green for sp2 bonds, and tan for sp bonds. The color coding of the diamond formation in the cube, inserted at the upper right corner, is identified by the diamond structure identification tool [Citation39] in the OVITO visualization package [Citation40]: blue for cubic diamond, light blue for the nearest neighbor of cubic diamond, orange for hexagonal diamond, and yellow for the nearest neighbor of hexagonal diamond.](/cms/asset/335590b6-1849-42db-be17-98d6046c5d5b/tfdi_a_2366807_f0004_c.jpg)
Figure 5. Relationships of (a) shear stress–strain, (b) σzz-strain, and (c, d) snapshots for a pre-compression rate of 25% in the z-axis graphite model sheared along the (001)<210> slip system at a strain rate of 0.1/ps, illustrating layer sliding. The green color coding of the atoms represents the sp2 bond state.
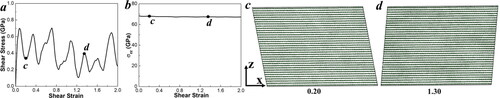
Figure 6. Relationships of (a) shear stress-strain, (b) σzz-strain, and (c-h) snapshots for a pre-compression rate of 30% in the z-axis graphite model sheared along the (001)<210> slip system at a strain rate of 0.1/ps, depicting the successive processes of (c) layer sliding, (d) atoms shifting along the z-axis, (e) initiation of graphite to diamond transition, and (f-g-h) diamond spreading. In each snapshot, the xz plane and layer a in the xy plane, where the initial spot of graphite-to-diamond transition occurs (indicated by red arrows), are displayed to clearly illustrate the process. The color coding of the atoms reflects their bond states: grey for sp3 bonds and green for sp2 bonds.
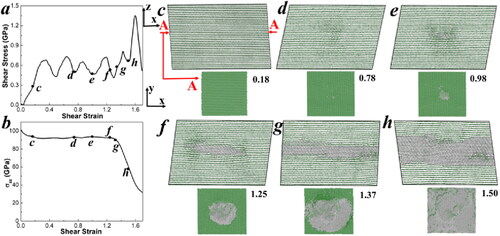
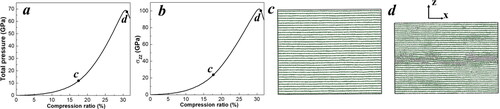
Figure 7. Relationships of (a) total pressure to compression ratio, (b) σzz-compression ratio, and (c, d) snapshots for compression rates of 17.5% and 31.5% in the z-axis graphite model. The color coding of the atoms is green for sp2 bonds and grey for sp3 bonds.