
Figures & data
Figure 1. Data processing for the inference of functional connectome and trial connectome activity. a. Functional connectome inference pipeline. For each session, FARCI is applied to produce the functional connectome. b-c. Trial-based connectome activity. Pairwise Pearson’s correlations are computed using the activities of neuron pairs for a rewarded trial (cue-to-reward), which are then filtered using a binary adjacency matrix obtained from functional connectome, to give the connectome activity of the trial.
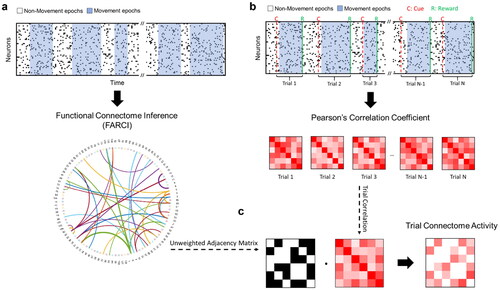
Figure 2. Neuronal population activity of L2/3 and L5 regions of primary motor cortex M1 in lever-press task learning. a. Lever-press task schematic. b. Mean duration between cue and reward, averaged across all rewarded trials from each session. c, d. Scores of the first three principal components (PCs) of neuronal population activity across sessions in L2/3 (Mouse L2/3-1) and L5 (Mouse L5-1) regions, respectively. Dark lines show the average values among trials. The neuronal population activities were extracted from a 98-frame window of every rewarded trial. The window was anchored by the movement onset time, which was set to be the 15th frame in this window. The green dot marks the starting time point.
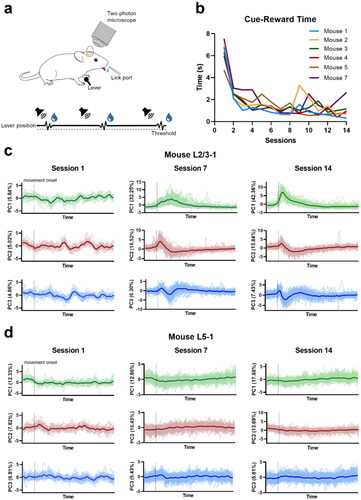
Figure 3. Functional connectome rewiring in L2/3 during lever-press task learning. The shaded areas indicate s.e.m., computed over the mice in the study. a. Connectome rewiring trajectories. Functional connectomes are projected onto PC1 and PC2 axes (see Methods). b–c. Average partial correlation coefficients of top 100 edges based on positive and negative magnitudes of PC1 and PC2 loadings. d. Network connectivity metrics of the functional connectomes. To aid comparison, normalized metrics are shown, using the highest value of each metric across sessions and animals as a scaling factor (see Supplementary Figure S24 for full results).
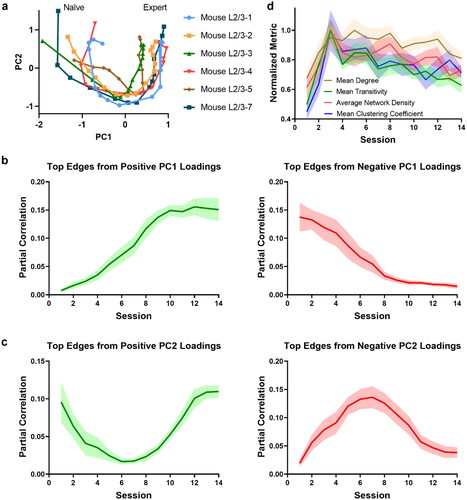
Figure 4. Functional connectome rewiring in L5 during lever-press task learning. The shaded areas indicate s.e.m., computed over the mice in the study. a. Connectome rewiring trajectories. Functional connectomes are projected onto PC1 and PC2 axes (see Methods). b–c. Average partial correlation coefficients of top 100 edges based on positive and negative magnitudes of PC1 and PC2 loadings. d. Network connectivity measures of the functional connectomes. To aid comparison, normalized metrics are shown, using the highest value of each metric across sessions and animals as a scaling factor (see Supplementary Figure S25 for full results).
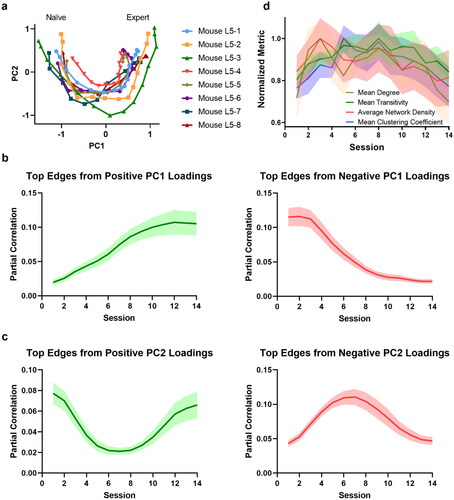
Figure 5. L2/3 connectome activity versus cue-to-reward time for rewarded trials. Each circle represents a rewarded trial and its color denotes the session number. The surface interpolation was done using MATLAB function cftool. The cue-to-reward time of each trial is projected onto the surface for visualization purposes.
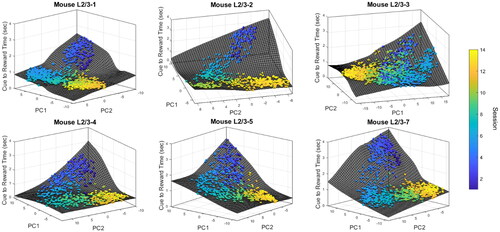
Figure 6. L5 connectome activity versus cue-to-reward time for rewarded trials. Each circle represents a rewarded trial and its color denotes the session number. The surface interpolation was done using MATLAB function cftool. The cue-to-reward time of each trial is projected onto the surface for visualization purposes.
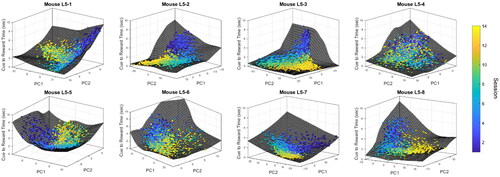
Figure 7. Correlations between the cue-to-reward time and pseudotime. Statistical significance was performed using two-sided two-sample t-test of Fisher z-transformed correlations (*: p-value < 0.05, **: p-value < 0.01).
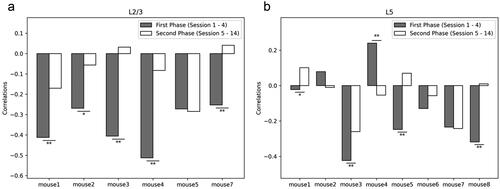
Figure 8. Analysis of top PC1 neurons in L2/3. a. Fractions of neurons from the top positive and the top negative PC1 loadings that are classified as movement related (* 5th upper percentile, ****0.01th upper percentile). b. Session-to-session connectivity change among core and non-core neurons. **** p-value < 10-4 (two-sided two sample t-test). c. Fractions of core, NP, EP and O neurons (n = 6 mice). d. Fractions of movement-related neurons among core, NP, and EP groups. In all figures, shaded regions and error bars represent s.e.m. (a and d) across all animals or (b) across neurons for each animal.
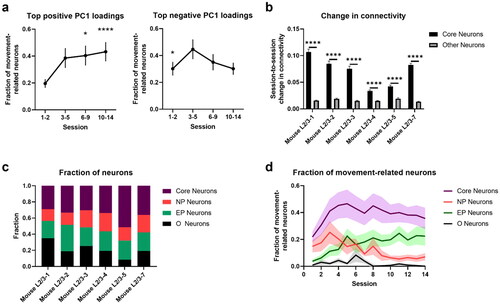
Table 1. Over-representation of movement-related neurons in Core, NP, EP, and Other neurons in L2/3.
Figure 9. Connectivity of top PC1 neurons. a. Mean degree of connectivity. b. Mean degree connectivity of Core neurons with Core, NP, EP, and Other neurons. The shaded area denotes s.e.m. computed across all animals.
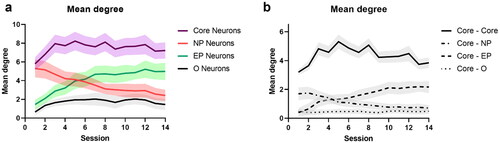
Figure 10. Neuronal activity and movement encoding. a. Mean neuronal activity of different groups in learning trials. b. Trial-to-trial activity correlation for different groups of neurons. (c–g) Correlations of activity vs. movement with respective expert patterns in cued trials (84-frame window) for all (c), Core (d), NP (e), EP neurons (f), and Other neurons (g). Naïve refers to session 1-3 and expert to session 10-14. h. Neuronal activity correlation with learned pattern for expert-like movements (corr. > 0.5) in naïve sessions. **** p-value < 0.0001 (one-sided paired t-test). Error bars indicate s.e.m computed across all L2/3 animals.
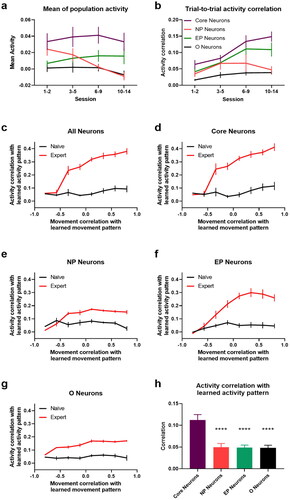
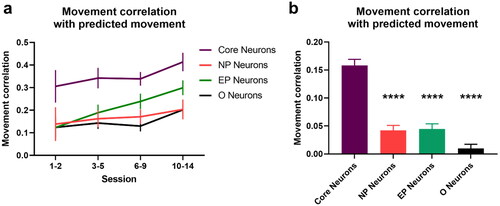
Figure 11. Encoding of movement in neuronal activity via linear decoders. a. Correlations between actual and predicted movement based on linear decoders built for each session and used to predict movements of the unseen trials of the same session. b. Correlations between actual and predicted movement for naïve sessions (session 1-3) using a linear decoder trained using data from expert sessions (session 10–14). **** p-value < 0.0001 (two-sided two-sample t-test). Error bars indicate s.e.m computed across animals.
Supplemental Material
Download PDF (2.4 MB)Data availability statement
Functional connectomes and MATLAB and Python codes used in this study are available at https://github.com/CABSEL/Connectome-Rewiring. The method FARCI is available at https://github.com/CABSEL/FARCI.