
Figures & data
Table 1. Median TRMSE and the SE values for Example 1 for the five methods considered with four error distributions
Figure 1. TRMSE distributions of the five methods considered with four error distributions for Example 1
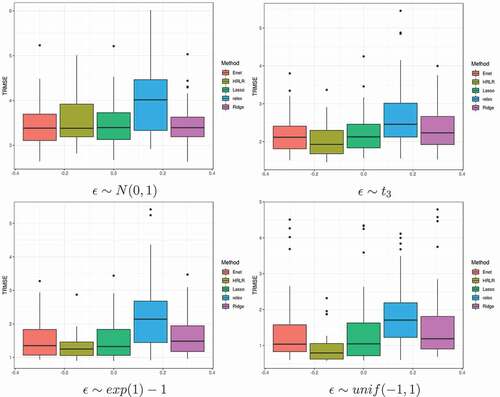
Figure 2. TRMSE distributions of the five methods considered with four error distributions for Example 2
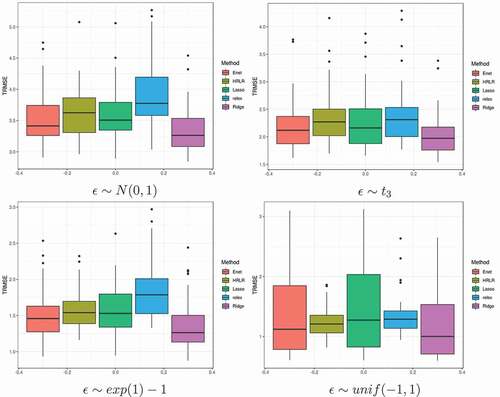
Figure 3. TRMSE distributions of the five methods considered with four error distributions for Example 3
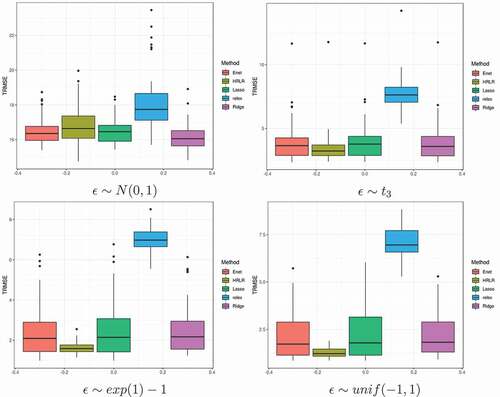
Table 2. Median TRMSE and the SE values for Example 2 for the five methods considered with four error distributions
Table 3. Median TRMSE and the SE values for Example 3 for the five methods considered with four error distributions
Table 4. Diabetes data
Table 5. Coefficient estimates for diabetes data for the five methods considered
Table 6. Coefficient estimates for bodyFat data for the five methods considered