Figures & data
Figure 1. Interaction diagram for the prey-predator model.
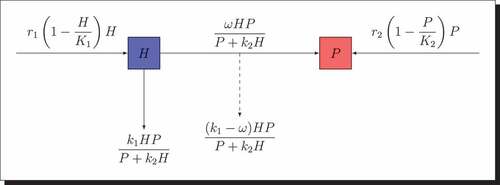
Figure 2. Interaction diagram for the prey-predator model when the disease spreads in the two populations.
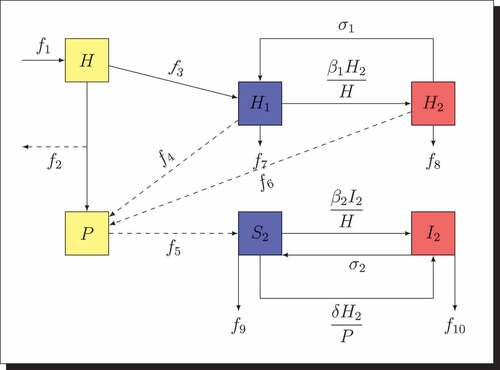
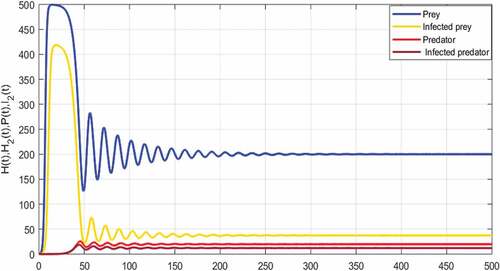
Figure 3. Global asymptotic stability of the coexisting equilibrium of model (2).
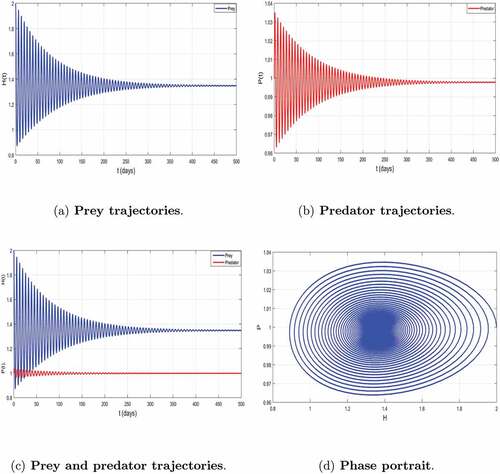
Table 1. Parameters values used for the numerical simulation of system (2)
Figure 4. Local asymptotic stability of the coexisting equilibrium of system (2) corresponding to .
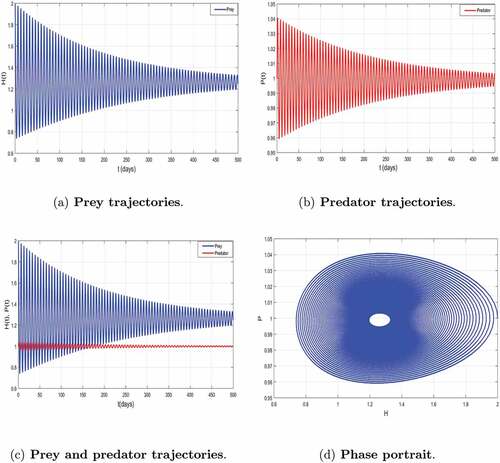
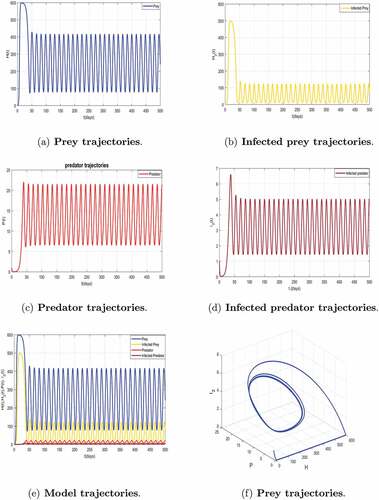
Figure 5. Dynamics of the trajectories of model (2) with periodic solutions with .
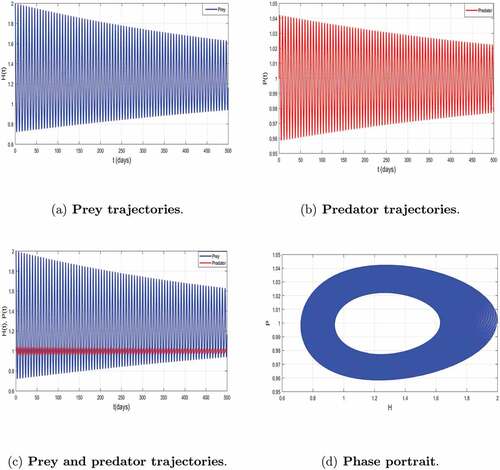
Figure 6. Global asymptotic stability of the coexisting equilibrium of model (5) when
and
.
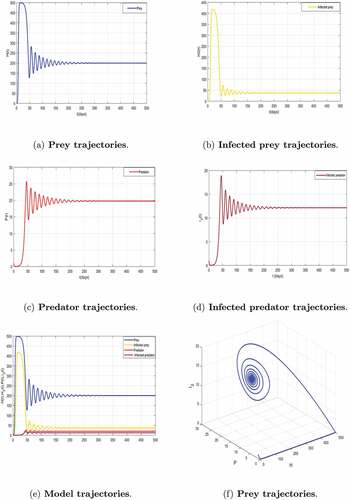
Table 2. Parameters values used for the numerical simulation of system (5)
Figure 7. Local asymptotic stability of the coexisting equilibrium of model (5) corresponding to
with
,
.
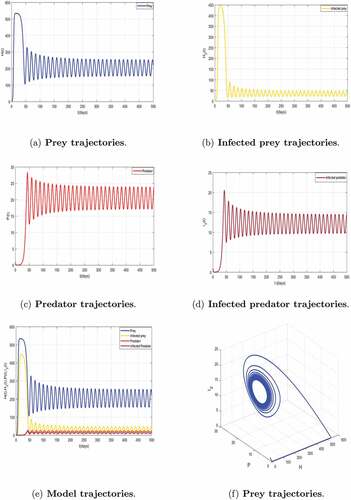
Figure 8. Hopf-bifurcation of system (5) with persistence of disease in two populations population corresponding to with
.