Figures & data
Figure 1. The basic elements in water supply system.(Tool 2.2 adopted from Bartram et al., 2009)
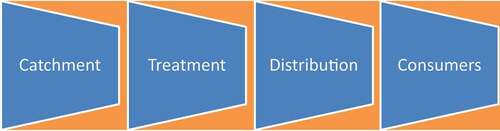
Table 1. Areas visited for questionnaire and response
Table 2. Respondents’ age
Table 3. Respondents’ sex
Table 4. Number of occupants in the House
Table 5. Educational status of respondents’
Figure 2. Graph showing the level of water quantity satisfaction by consumers
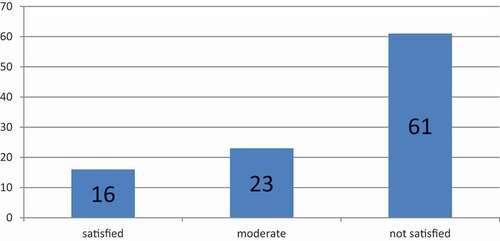
Figure 3. A graph showing level of water quality satisfaction by consumers. A graph showing home water treatment practices by consumers
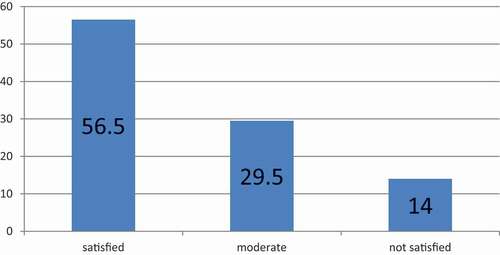
Figure 4. A graph showing level of water quality satisfaction by consumers. A graph showing home water treatment practices by consumers
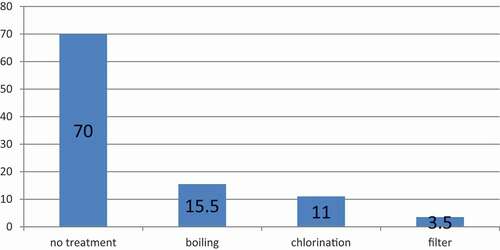
Table 6. Results of chemical and physical parameters
Table 7. Microbiological analysis results (Total coliforms count results)
Table 8. Microbiological analysis results (Fecal coliform test; Escherichia coli)