Figures & data
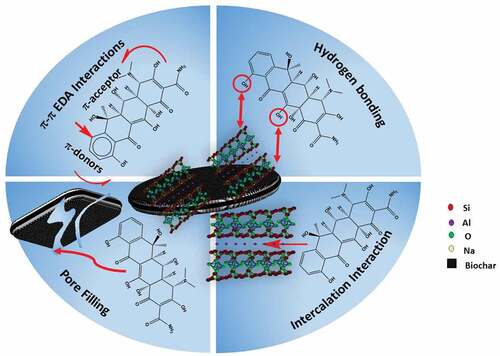
Figure 1. SEM images of MSW-BC (a) and MSW-BC-MMT (b) with visual modifications.
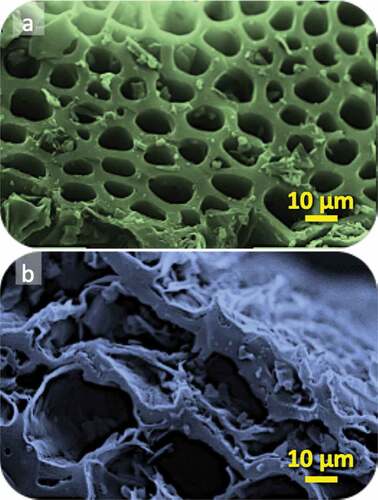
Table 1. BET surface analysis results and interlayer spacings (d001) in MSW-BC, MSW-BC-MMT and their changes with OTC interaction
Figure 2. PXRD patterns of MSW-BC, MMT, MSW-BC-MMT and MSW-BC-MMT-OTC.
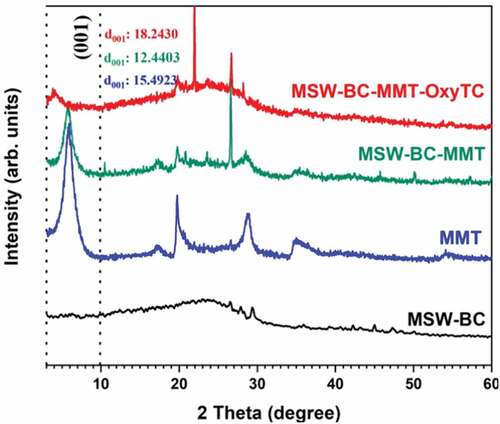
Figure 3. FTIR spectrum of pure (a) MSW-BC, MMT and OTC material along with the treated and untreated composites. (b) Enlarged spectrum from the wavelengths of 1200–1700 cm−1.
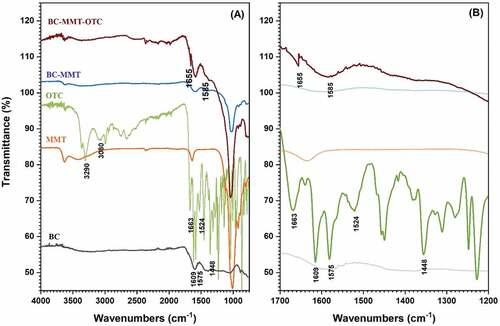
Figure 4. pH vs OTC adsorption capacities of MSW-BC and MSW-BC-MMT composite.
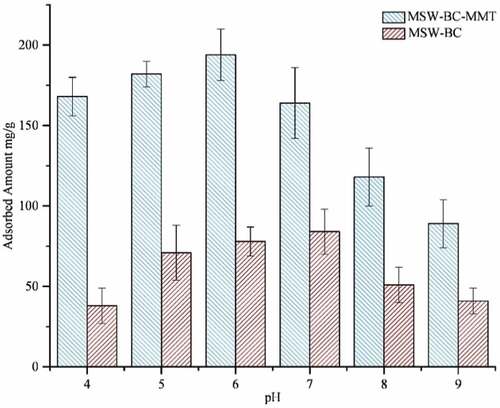
Figure 5. Redlich–Peterson and Temkin isotherm models for the adsorption of OTC by MSW-BC-MMT composite.
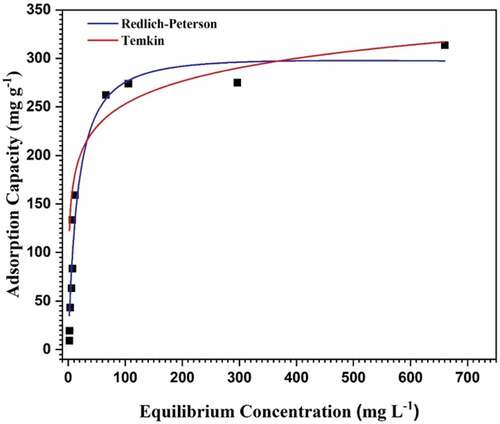
Table 2. Kinetic and isotherm model parameters for the adsorption of OTC onto MSW-BC-MMT
Figure 6. Elovich kinetic model and pseudo-second-order model for adsorption of OTC by MSW BC-MMT composite.
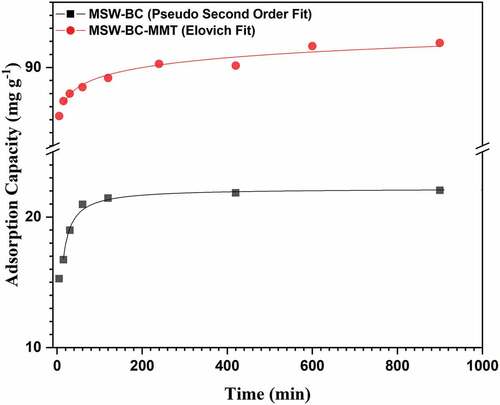
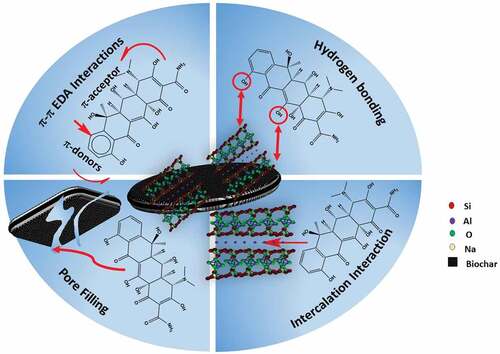
Figure 7. Conceptual illustration of the possible mechanisms of OTC adsorption on MSW-BC-MMT composite.