Figures & data
Figure 1. Location Map of the Study Area.
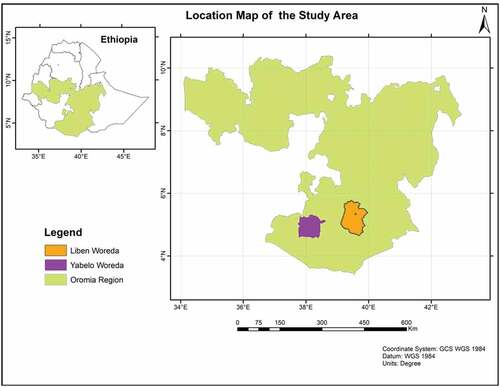
Figure 2. Schematic diagram showing transects and plots layout for woody vegetation, herbaceous vegetation and soil sampling.
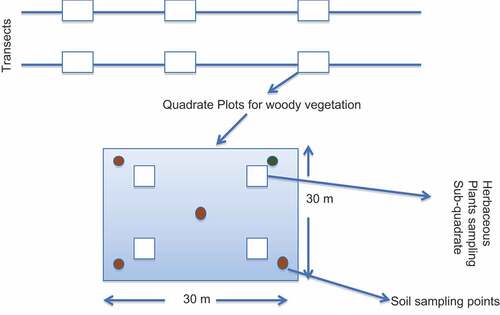
Table 1. Type, status and number of stems of trees and shrubs recorded in Gomole
Figure 3. Carbon stock in the woody vegetation by management status measured in the dry and wet seasons (letters on error bars indicate significant difference at α = 0.001).
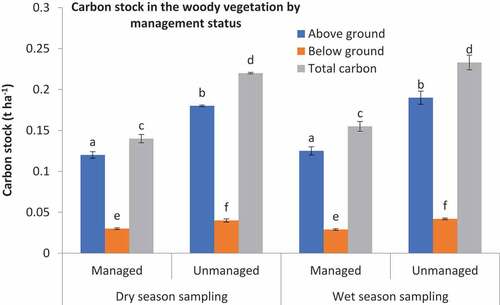
Figure 4. Carbon stock in the woody vegetation by seasonal grazing management measured in the dry and wet seasons (letters on error bars indicate significant difference at α = 0.001).
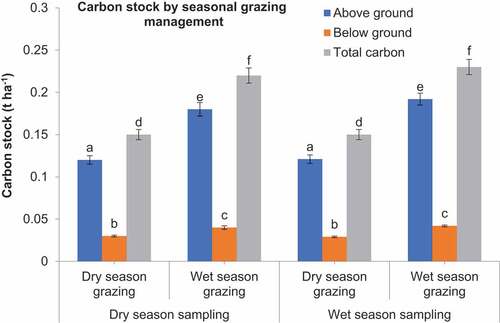
Figure 5. Herbaceous vegetation cover in the managed and unmanaged rangelands measured in the dry and wet seasons (letters on error bars indicate significant difference at α = 0.05).
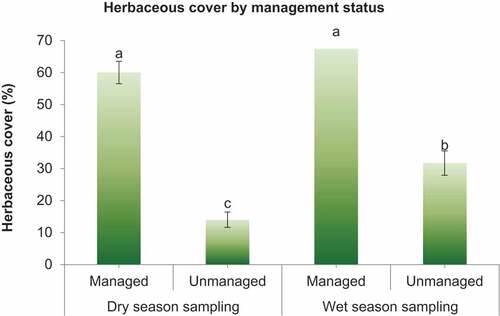
Figure 6. Carbon stock in the herbaceous vegetation in managed and unmanaged rangelands in the dry and wet seasons (letters on error bars indicate significant difference at α = 0.05).
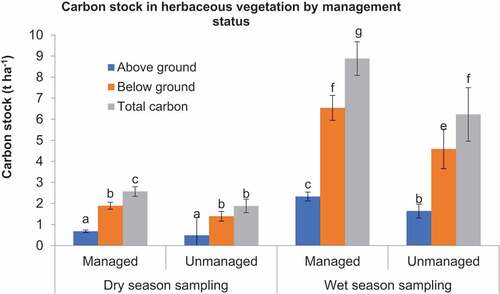
Figure 7. Herbaceous cover by vegetation types (BUL = bush land; GL = grassland; TS = tree Savannah) measured in the dry and wet seasons (letters on error bars indicate significant difference at α = 0.05).
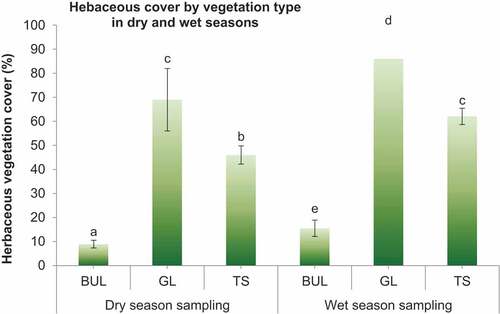
Figure 8. Carbon stock in the herbaceous biomass in the woody vegetation types (BUL = bush land; GL = grassland; TS = tree Savannah) measured in the dry and wet seasons (letters on error bars indicate significant difference at α = 0.05).
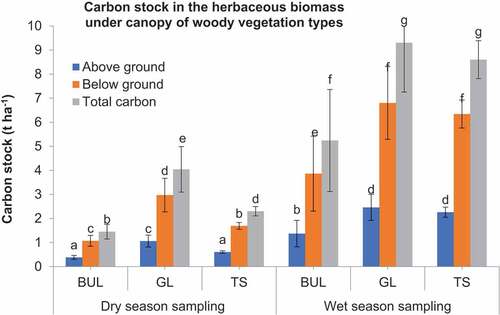
Table 2. Mean (±SE) soil carbon stock in Gomole rangeland grazing system by management status, woody vegetation types and seasonal grazing as measured in the dry and wet seasons (n = 94)
Figure 9. Total carbon stock by management and vegetation types averaged over seasonal measurements in the Gomole grazing system.
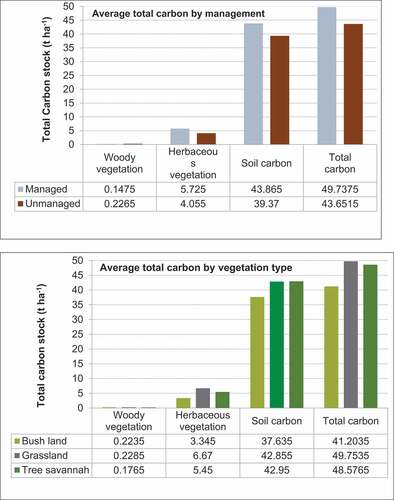
Table 3. The common tree and shrub species and total number of stems recorded from the sampled areas in the Dida Dheeda grazing system
Figure 10. Carbon stock in the woody vegetation by management status in Dida Dheeda rangeland grazing system measured in the dry and wet seasons (letters on error bars indicate significant difference at α = 0.05).
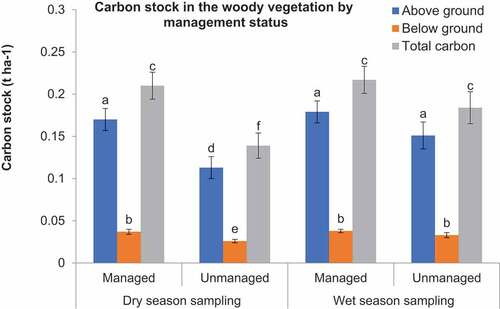
Figure 11. Carbon stock in the woody vegetation by seasonal grazing management in Dida Dheeda grazing system measured in the dry and wet seasons (letters on error bars indicate significant difference at α = 0.05).
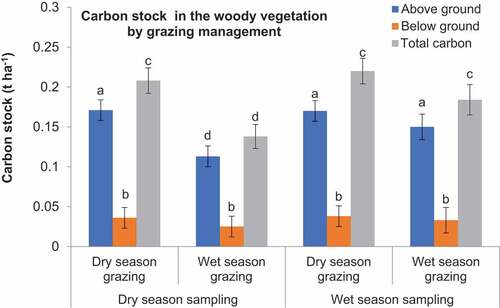
Figure 12. Herbaceous vegetation cover in the managed and unmanaged rangelands in Dida Dheeda grazing system measured in the dry and wet seasons (letters on error bars indicate significant difference at α = 0.001).
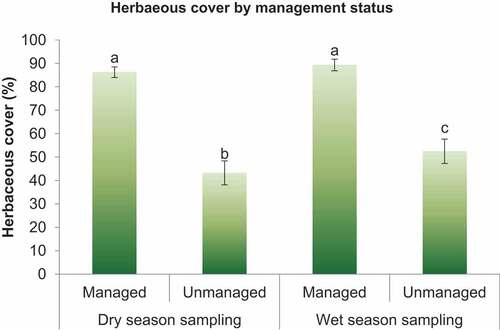
Figure 13. Herbaceous vegetation carbon stock in the managed and unmanaged rangelands in Dida Dheeda rangeland grazing system in the dry and wet seasons (α = 0.001).
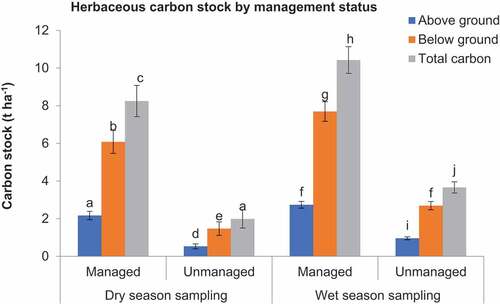
Figure 14. Herbaceous vegetation cover in the woody vegetation types in the dry and wet seasons in Dida Dheeda (α = 0.05).
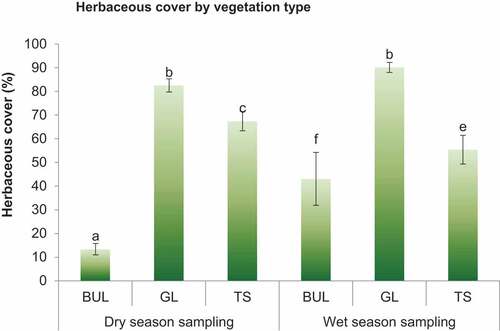
Figure 15. Carbon stock in the herbaceous vegetation in different vegetation types in the dry and wet seasons in Dida Dheeda (α = 0.05).
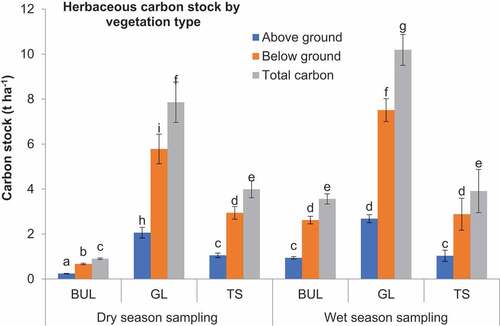
Table 4. Mean (±SE) soil carbon stock (t ha−1) in rangelands by management status, vegetation types and seasonal grazing management in the dry and wet seasons in Dida Dheeda grazing system (n = 55)
Figure 16. Total carbon stock by management and vegetation type averaged over seasonal measurements in the Dida Dheeda grazing system.
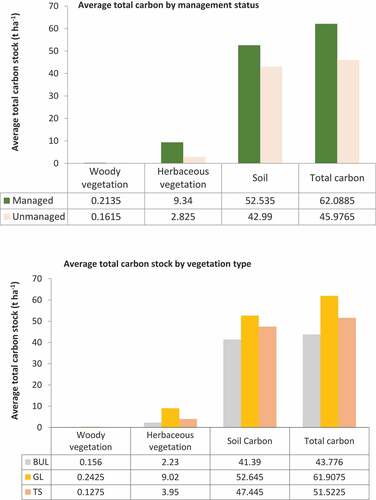
Figure 17. Relationship between soil carbon stock and herbaceous biomass cover in the Gomole and Dida Dheeda grazing systems.
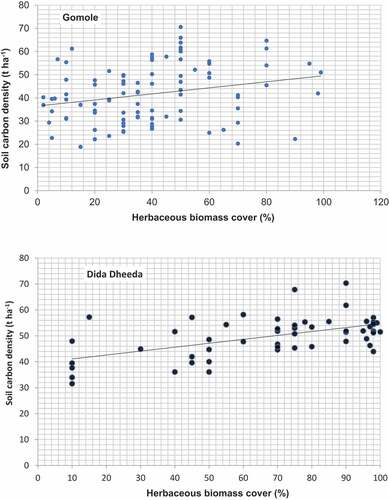
Figure 18. Relationship between soil carbon stock and soil bulk density in the Gomole and Dida Dheeda grazing systems.
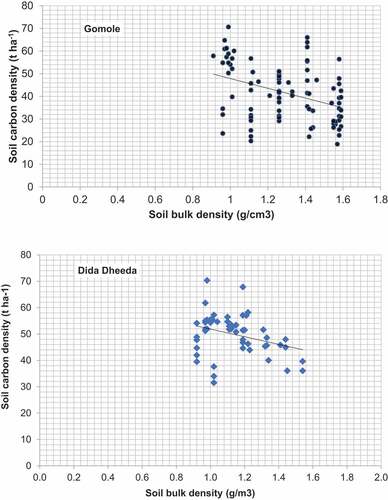
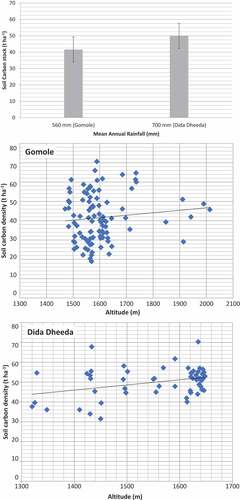
Figure 19. Relationship between soil carbon stock, rainfall and altitude in the Gomole and Dida Dheeda grazing systems.
Data availability statement
The data that support the findings of this study are available from the corresponding author, MA upon reasonable request.