Figures & data
Figure 1. Schematic diagram of free surface flow constructed wetland cells with 3 different native plants.
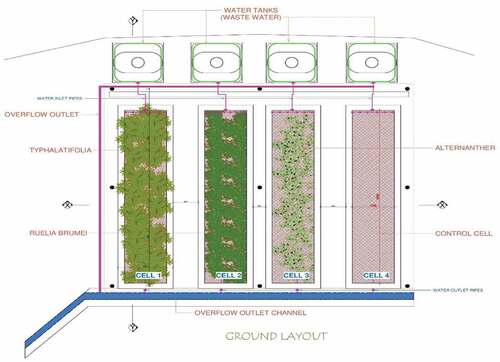
Table 1. Characteristics of effluent after conventional treatment and discharge limit
Table 2. Characteristics of media (soil) in the free surface flow constructed wetlands
Table 3. Descriptive statistics for plant growth (height), biomass and water content of the three plant species
Table 4. Contaminants removal efficiency of the native plants in a free water surface flow constructed wetland