Figures & data
Figure 1. Proposed research model
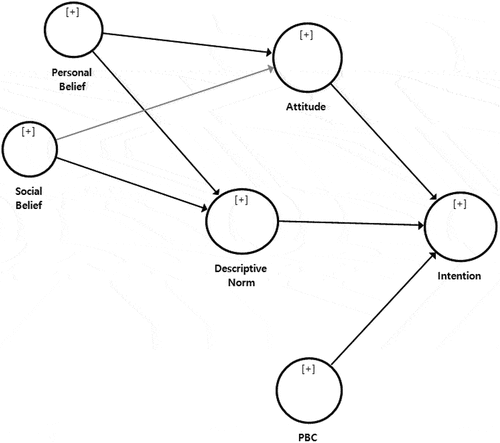
Figure 2. Research process
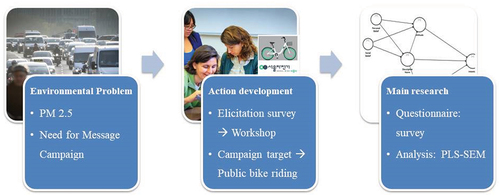
Table 1. Demographics of study participants (N = 250)
Table 2. Descriptive statistics of and correlations among IMBP constructs
Table 3. The result of internal consistency reliability, convergent validity, and discriminant validity (max. iteration 300)
Table 4. The result of inner model (structural model) analysis (bootstrapping 5,000 in sample)
Table 5. Path model results of direct effects (significance)
Figure 3. Results of bootstrapping the model (R square = 58) (Bootstrapping 5,000 in sample)
Note: black line: significant, gray line: insignificant
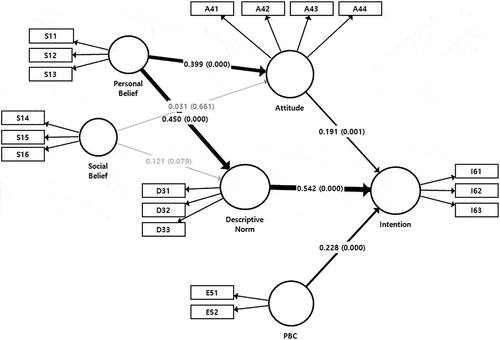
Table 6. Path model results of indirect effects (significance)
Data Availability Statement
Data for this article can be accessed https://doi.org/10.6084/m9.figshare.19103180