Figures & data
Figure 1. Location map of the study area.
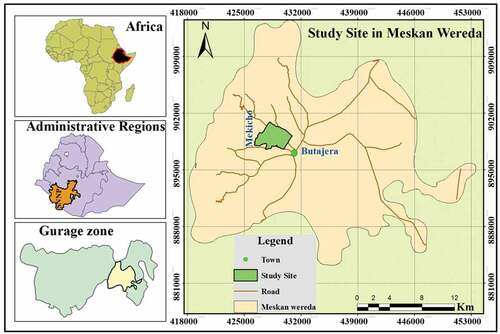
Figure 2. Climatic condition of the study area (Source: NMSA, 2015).
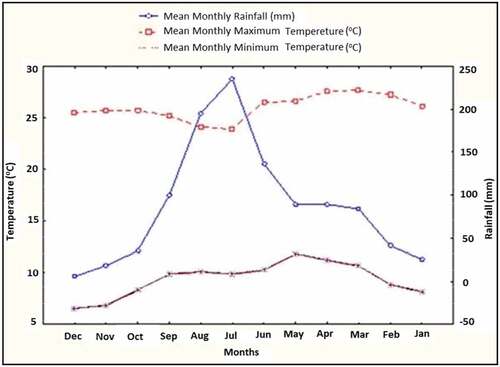
Figure 3. Soil sampling points from the five different land use systems; WL = wood lot; EF: enset field; GL: grazing land; FL: annual crops field (farmland).
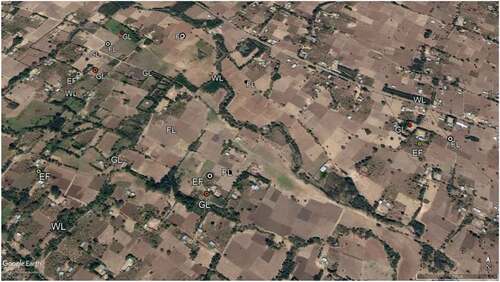
Figure 4. Open and closed grazing lands are located close and far from homestead.
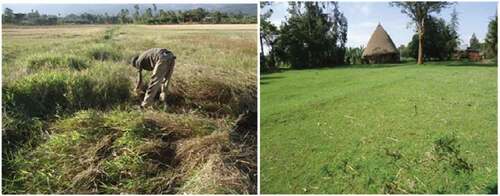
Figure 5. Enset system receives large amount of organic inputs.
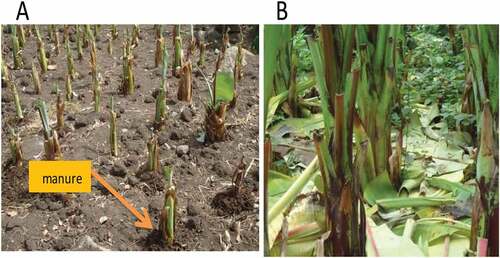
Table 1. Description of the studied land use types in the central highlands of Ethiopia
Table 2. Soil physical properties across different land use types at 0 − 45 cm soil depth in central Ethiopia
Table 3. Soil chemical properties across different land use types at 0 − 45 cm soil depth in central Ethiopia
Table 4. Effects of land use types on soil organic carbon (SOC) and total nitrogen (TN) stocks in central Ethiopia
Analysis of Variance (ANOVA) for soil bulk density.
Analysis of Variance (ANOVA) for clay content.
Analysis of Variance (ANOVA) for silt content
Analysis of Variance (ANOVA) for sand content
Two-Way Analysis of Variance (ANOVA) for exchangeable K
Analysis of Variance (ANOVA) for CEC level
Analysis of Variance (ANOVA) for organic carbon content
Analysis of Variance (ANOVA) for total nitrogen content
Analysis of Variance (ANOVA) for available P content
Analysis of Variance (ANOVA) for organic carbon stocks
Analysis of Variance (ANOVA) for total nitrogen stocks
ANOVA soil organic carbon stocks for entire soil profile (0–45 cm)
Analysis of variance(ANOVA) for total nitrogen stocks for entire soil profile