Figures & data
Figure 1. The two-dimensional cyclical model for plastic waste management (Addor et al., Citation2022a).
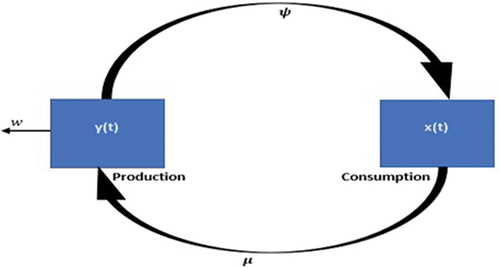
Figure 2. Global annual plastic production, waste generation, recycling, discarded and incineration.
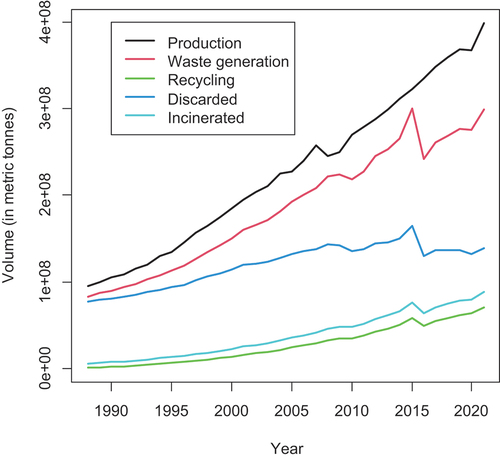
Table 1. Values of parameters and their sources
Table 2. A summary of computational technique for and
Figure 3. A time series representation of the transitional probabilities for plastic waste generation under the: (a) full forces of incineration and discarding, (b) full force of discarding without incineration and (b) full operation of incineration without discarding.
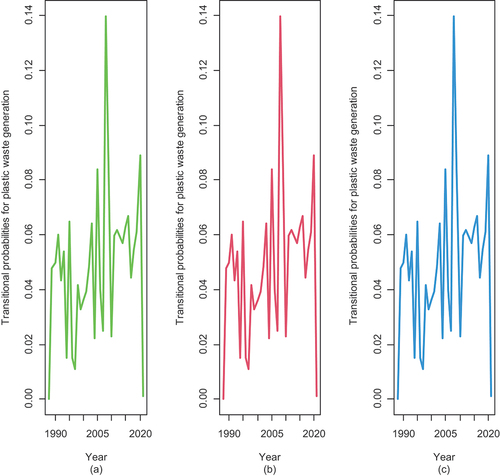
Figure 4. A time series plot of the transitional probabilities for plastic recycling under the: (a) full forces of incineration and discarding, (b) full force of discarding without incineration and (b) full operation of incineration without discarding.
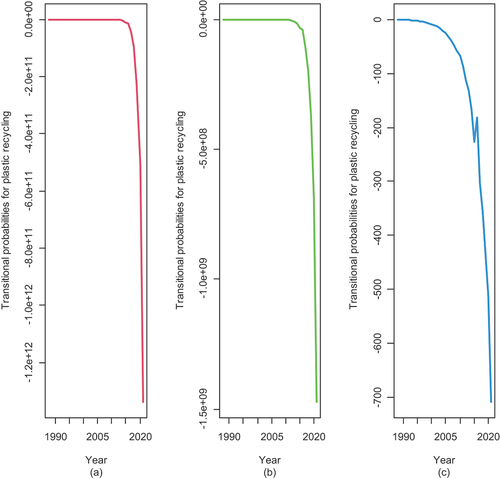
Figure 5. Plastic recycling and waste generation probabilities with total riddance of incineration and discarding.
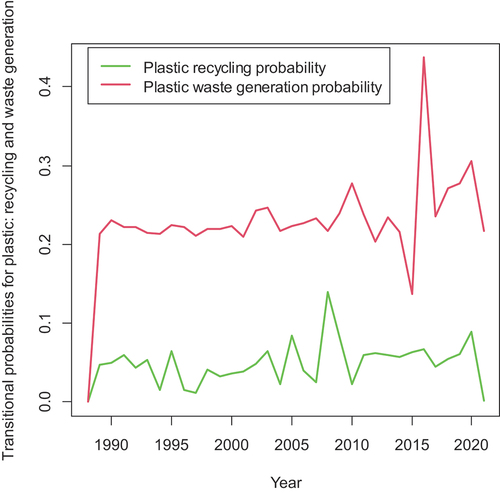
Figure 6. A time series plot of the transitional probabilities for plastic waste recycling at 64% (10% increase from 54%) and 44% (10% decrease from 54%) of waste generation rate of packaging application (uncensored) plastic wastes ().
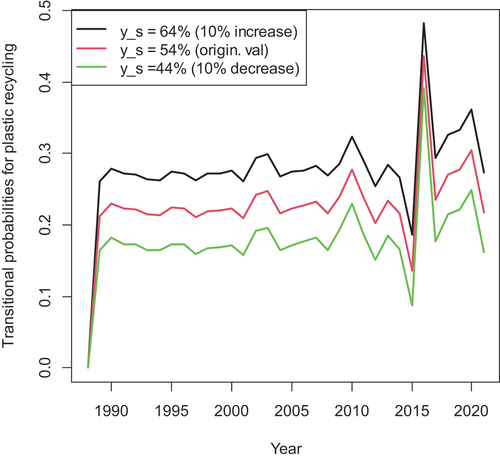
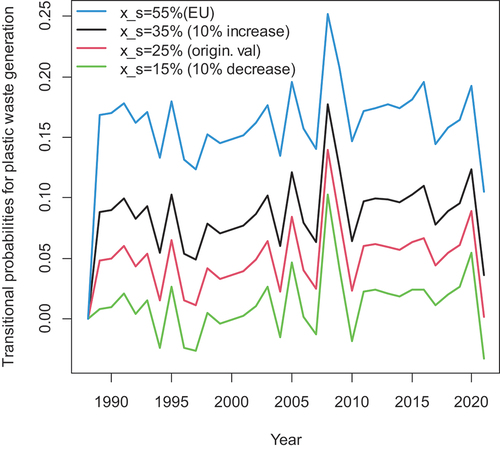
Figure 7. A time series representation of the transitional probabilities for plastic waste generation at 35% (a), 25% (b), 15% (c) and 55%(d) rate of recycling uncensored (packaging) plastic waste. 35% represents 10% increase from 25%; 15% represents 10% decrease from 25%; and 55% is the European Union’s (EU’s) target set.