Figures & data
Figure 1. Municipalities of Puebla, located in the TMCF.
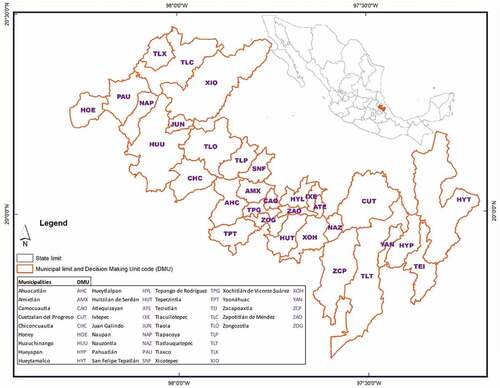
Table 1. Descriptive statistics of inputs (x), outputs (y), and environmental determinants
Table 2. Matrix of outliers for the initial sample
Graph 1. Log-ratio for the initial sample.
Graph 2. Bias-corrected efficiency estimates and 95% confidence intervals (Source: elaborated by the authors).
Table 3. Eco-efficiency
Graph 3. Boxplot of the corrected eco-efficiency indexes for the groups (Source: elaborated by the authors).
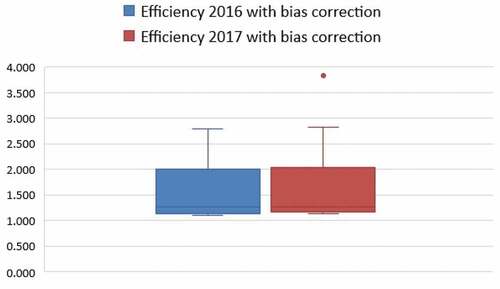
Table 4. Corrected eco-efficiency statistics for the Kolmogorov-Smirnov and Kruskal-Wallis groups and tests
Figure 2. Temperature, precipitation, and eco-efficiency of 2016 in the study area.
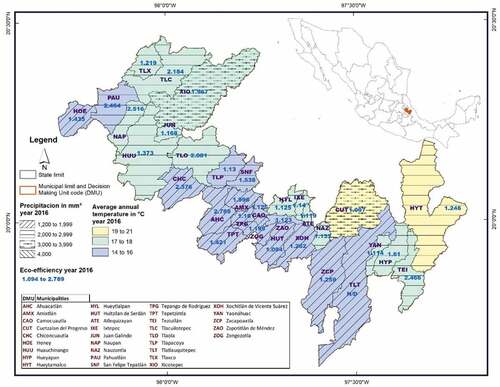
Figure 3. Temperature, precipitation, and eco-efficiency of 2017 in the study area.
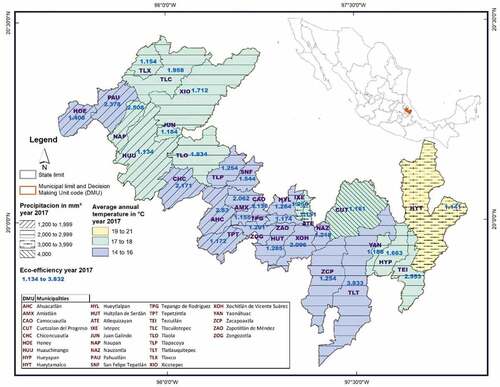
Table 5. Second stage model estimates
Data Availability Statement
The database used and the data sources can be found in the open access link located in: https://data.mendeley.com/datasets/gf6xnkb5tw/1 and doi:10.17632/gf6xnkb5tw.1.