Figures & data
Figure 1. Main approaches and authors linked to communicating risks. Sources of information (Heath & O’Hair, Citation2020; Lundgren & McMakin, Citation2018).
Table 1. Statistics on extreme natural events and disasters in South America from 2016 to 2021. Source (CEPAL, Citation2022)
Table 2. Explanation of the independent variables
Figure 2. Publications published and cited on South America in WoS as of December 2, 2021.
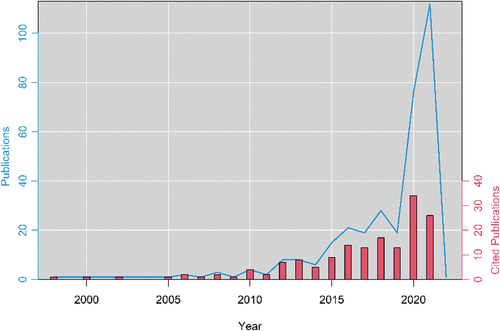
Table 3. Percentage of scientific publications (N = 330), times cited, the average of citations per item, and H-index related to risk and crisis communication regarding South America
Table 4. Percentage of publications by hazard type. The hazards type was examined using the keyword co-occurrence map (section 3.2): diseases = covid-19, disease, pandemic; human activities = agricultural, mining, industry; climate change = climate change, climate change communication; and natural extremes = volcanoes, earthquake, flood
Figure 3. Keyword co-occurrence network constructed from 83 words with a minimum frequency of five words.
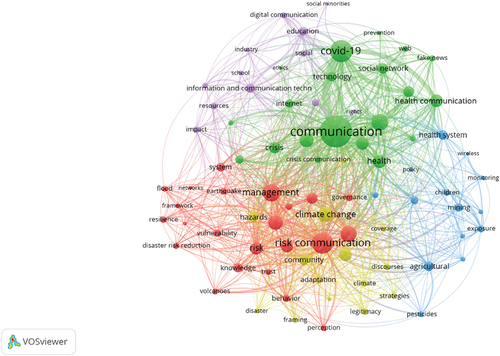
Table 5. Factors for risk communication in vulnerable areas (red cluster)
Table 6. Factors for health and crisis communication (green cluster)
Table 7. Factors associated with the communication of human and environmental exposure to pollutants (blue cluster)
Table 8. Management of continuity and communication quality (yellow cluster)
Table 9. Enhancers for environmental and climate change communication (purple cluster)
Figure 4. Co-citation map. Minimum of eight citations of an author.
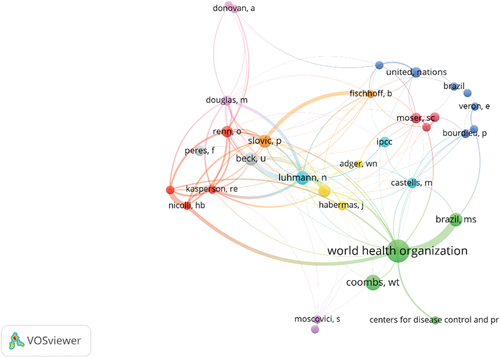
Figure 5. Cross-analysis between the most cited authors and communication factors (see section 3.2). Only the most significant relationships were represented.
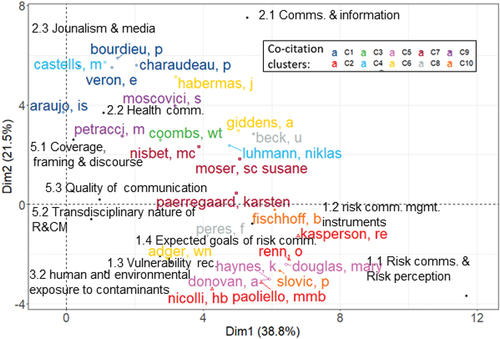
Figure 6. Network visualization map of inter-country cooperation for communication research. The map was created with VOSviewer software version 1.6.16. The minimum number of documents in a country was 5.
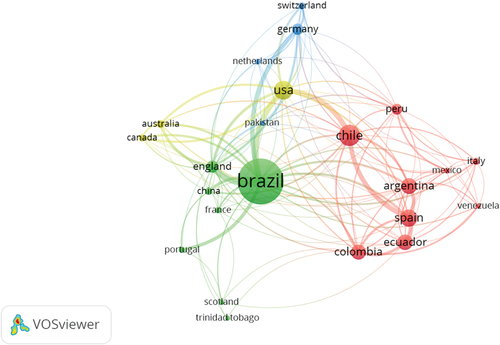
Figure 7. Relationship between total publications and H-index of the countries that have published through cooperation networks. The size of the circles indicates the average number of citations per article.
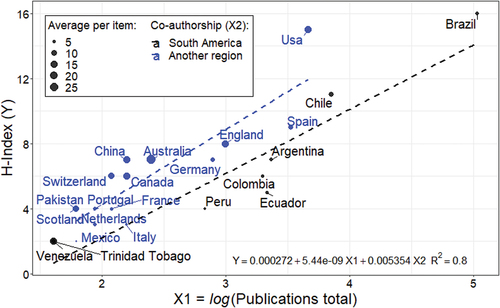
Figure 8. Map of co-authorship by authors with two or more publications (48 authors out of a total of 1,189). The size of the circle refers to the number of publications.
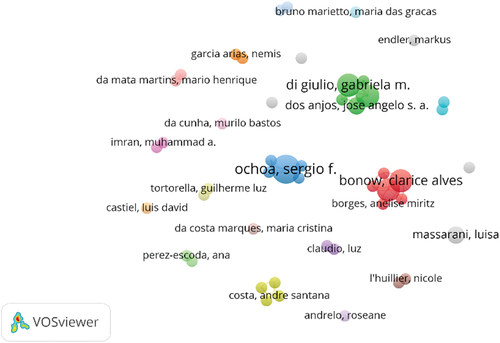
Figure 9. Classification of publications on R&CC according to the research area proposed by web of science.
Table 10. Authors with three or more publications
Figure 10. Principal component analysis of the factors of risk and crisis communication regarding South America.
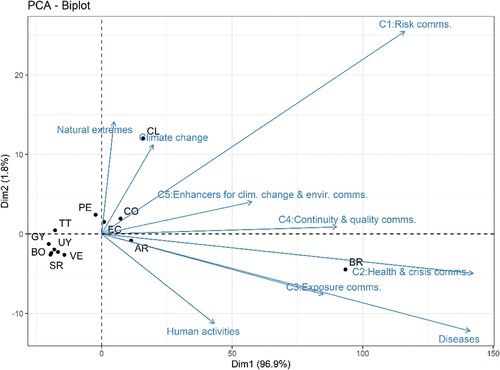
Table 11. Determinants of communication research in the face of risks and crises
Figure 11. Compositional estimation of the determinants of R&CC.
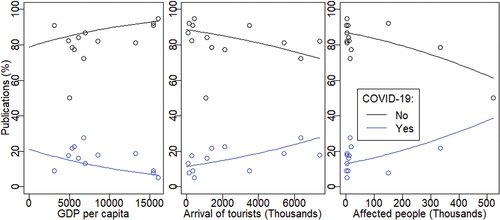
Figure 12. The value of scientific research in the context of R&CC systems.
Data availability statement
The paper is based on the Web of Sciences (WoS) online scientific information service.