Figures & data
Figure 1. The upward trend of Climate Change Risk Research in scopus.
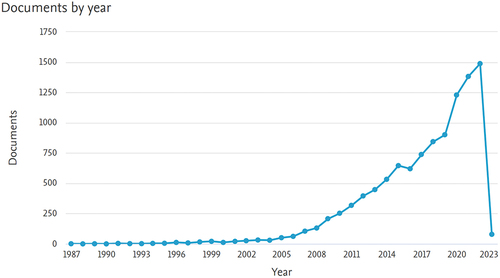
Table 1. The descriptive statistics of organizational context
Table 2. ANOVA of 3 cluster to show the significant climate adaptation and mitigation across maturity level
Table 3. The result of overall maturity level from clustering
Table 4. Maturity Level Across Company Size
Table 5. Maturity level across sectors
Figure 2. Linearity testing.
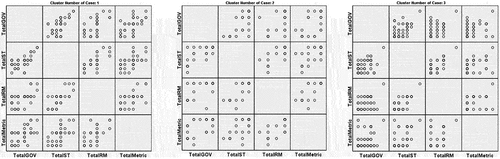
Table 6. Testing normality and multicollinearity
Table 7. ANOVA of determinants and maturity of climate risk
Table 8. Overall model fit
Table 9. Determinants size effect
Table 10. Classification results
Figure 3. Proposed conceptual framework.
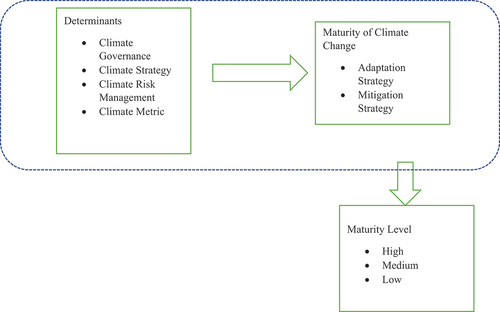
Table 11. Refined model with MDA Stepwise
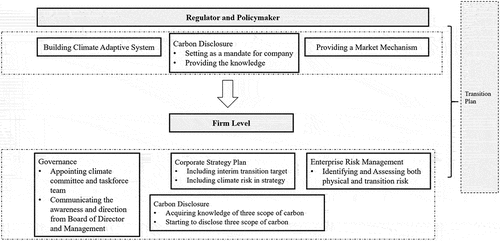
Figure 4. Proposed policy recommendation Model.
Data availability statement
The data that support the findings of this study are available from the corresponding author upon request.