Figures & data
Table 1. Summary of plastic recycling and waste generation based on four scenarios
Table
Figure 1. Plastic recycling transitional probabilities with innovation-driven separation.
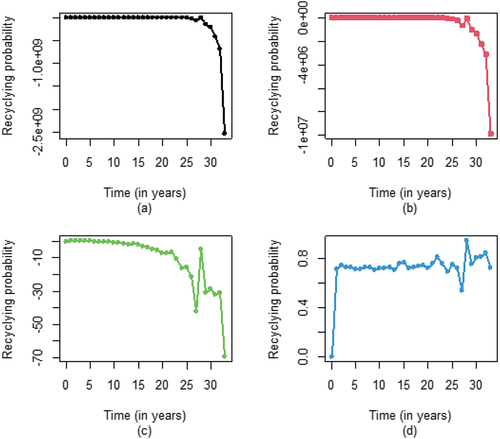
Figure 2. Plastic recycling transitional probability with non-innovation-driven separation.
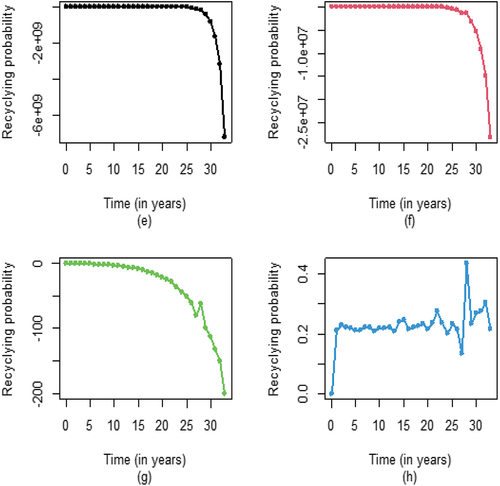
Figure 3. Innovative versus non-innovative separation-based recycling.
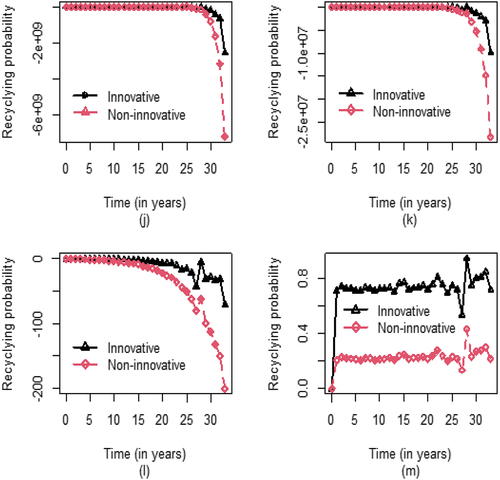
Figure 4. Plastic waste generation transitional probabilities with the integrated roles of separation with and without innovation.
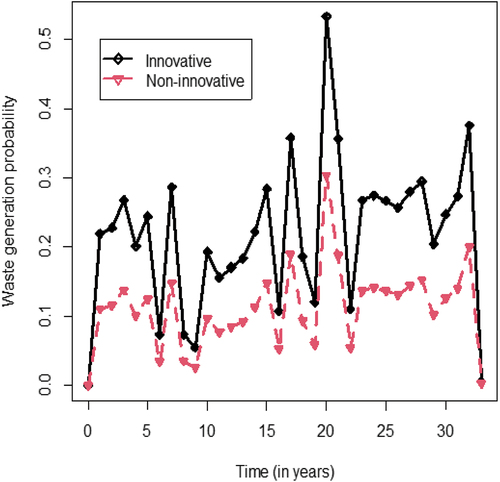
Figure 5. Sensitivity of plastic waste recycling to variations in innovation.
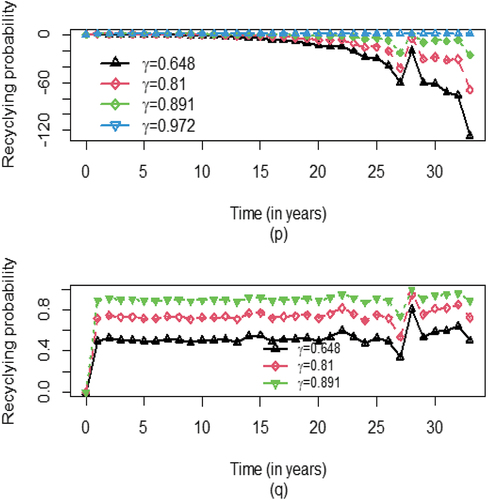
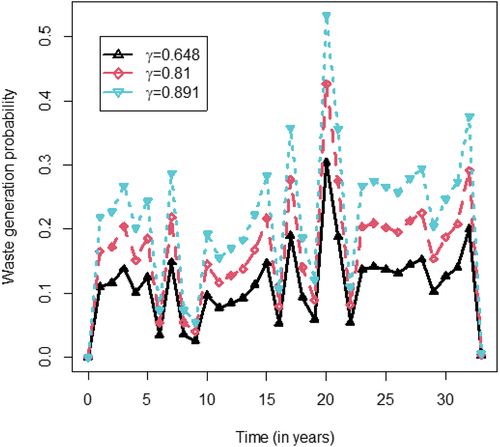
Figure 6. Sensitivity of the plastic waste generation probability subject to variation in innovation.
Data availability statement
Data will be made available upon request to the corresponding author.