Figures & data
Figure 1. Location map of Adama City.
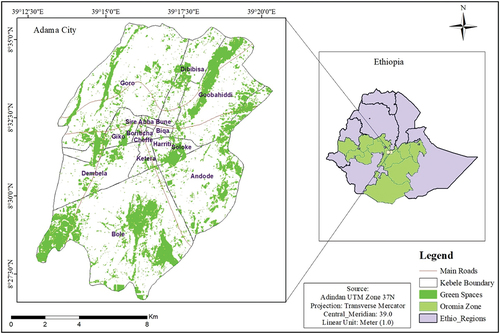
Table 1. Data types and sources
Table 2. Remote sensing images
Figure 2. Methodological flow chart.
Table 3. Software used for the study
Table 4. Accuracy assessment of land use and land cover for 2000, 2013 and 2023
Figure 3. LU/LC maps of the year 2000 (A), 2013 (B) and 2023(C).
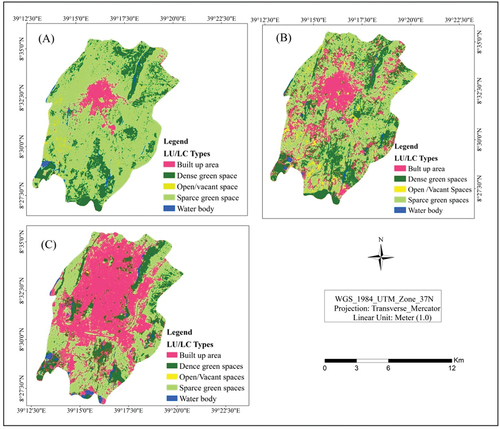
Table 5. Land Use/land cover (LU/LC) of the Year 2000, 2013 and 2023
Table 6. Summary of LST values of the year 2000, 2013 and 2023
Figure 4. LST map of the year 2000(A) and 2013(B) and 2023(C).
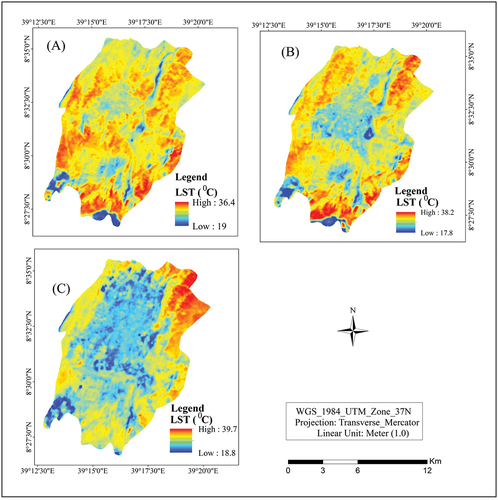
Table 7. Variations of LST values from the year 2000 to 2023
Figure 5. Built-up areas of Adama City in 2000 (A), 2013 (B) and 2023 (C).
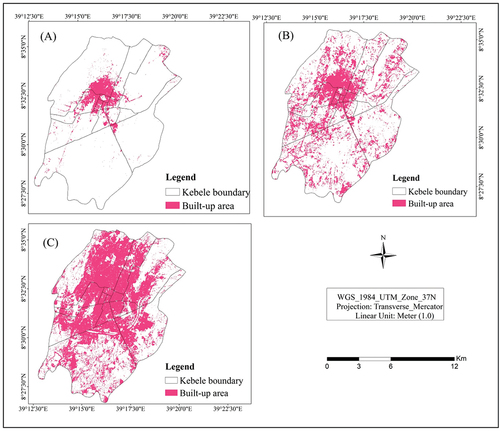
Figure 6. Relationship between LST and NDBI.
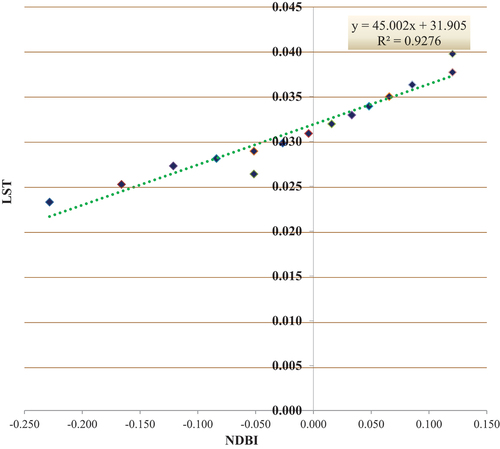
Figure 7. Normalized difference vegetation index for the year 2000(A), 2013(B) and 2023(C).
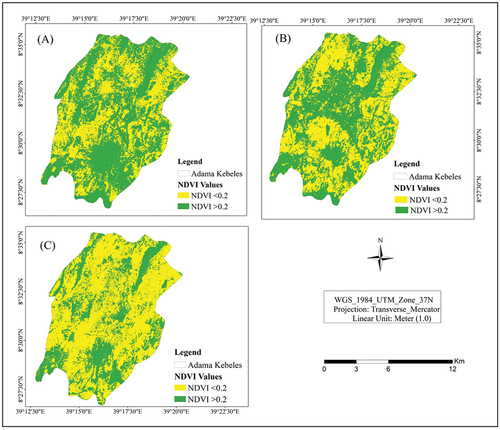
Table 8. Comparisons of the NDVI values in the year 2000 and 2023
Figure 8. Relationship between LST and NDVI.
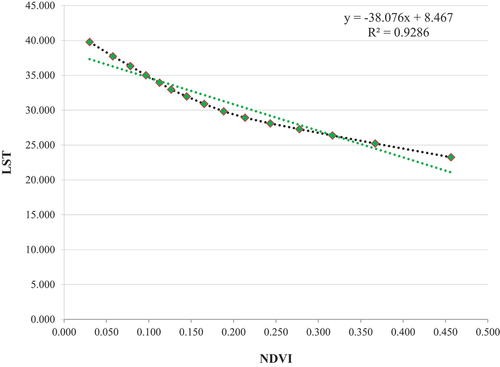
Figure 9. Estimation of LST in the selected test spot in Adama City.
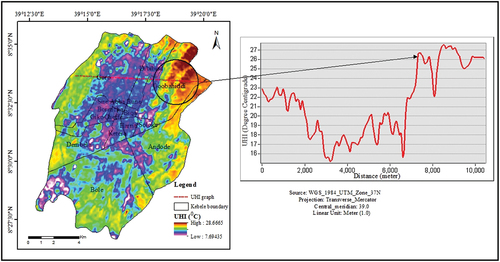
Table 9. Estimated LST value of selected test spot (Gooba Hiddii Kebele)
Figure 10. Relationship between change in LST (°C) and green space area (ha).
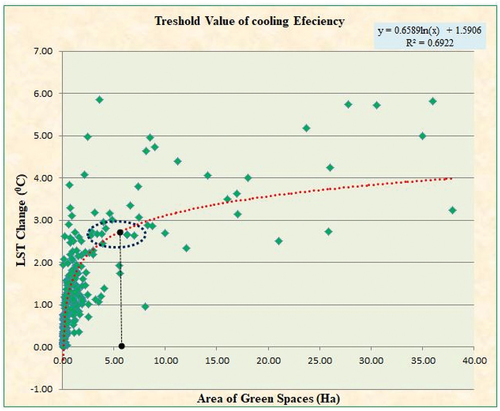
Figure 11. LST change with respect to areas of green spaces.
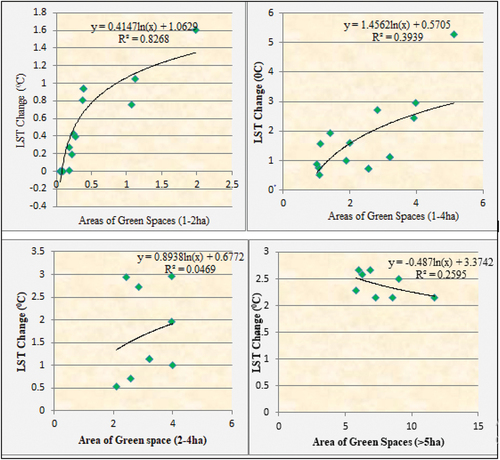
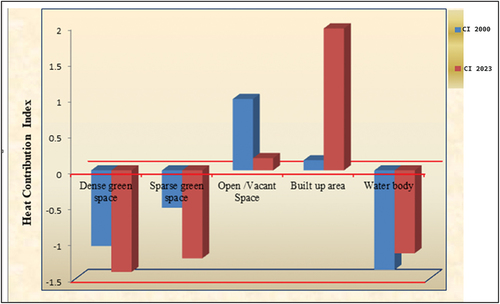
Figure 12. Heat contribution index of LU/LC of the years 2000 and 2023.