Figures & data
Table 1. Coordinates for selected Avicennia marina mangrove locations on the southern coast of Saudi Arabia, Red Sea
Figure 1. Curve-fitting models for volumetric SOC density (kg C/m3) as a function of soil profile (m) in protected and grazed Avicennia marina mangrove locations. FLocation = 106.9***; FDepth = 9.7***; FLocation × Depth = 4.5***; F-values represent a two-way repeated measures ANOVA results; ***: p < 0.001.
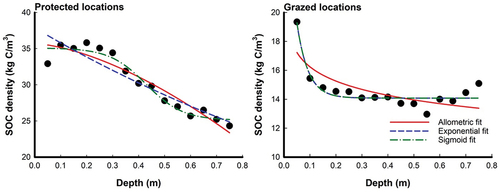
Figure 2. Curve-fitting models for cumulative SOC stock (kg C/m2) as a function of soil profile (m) in protected and grazed Avicennia marina mangrove locations. FLocation = 123.5***; FDepth = 751.5***; FLocation × Depth = 87.9***; F-values represent a two-way repeated measures ANOVA results; ***: p < 0.001.
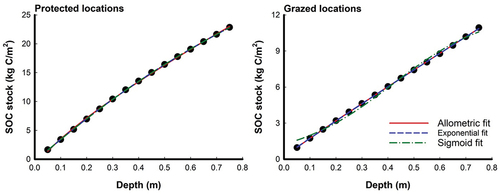
Table 2. Statistical summary of soil bulk density (g/cm3) at different depth intervals in protected and grazed Avicennia marina mangrove locations
Table 3. Statistical summary of soil organic carbon contents (g C/kg) at different depth intervals in protected and grazed Avicennia marina mangrove locations
Table 4. Model parameters and fitting results for volumetric SOC density (kg C/m3) using three equations in in protected and grazed Avicennia marina mangrove locations
Table 5. Model parameters and fitting results for cumulative SOC stock (kg C/m2) using three equations in protected and grazed Avicennia marina mangrove locations
Figure 3. Volumetric densities of SOC in the upper 75 cm of soil, expressed as TCFs (0–10/0–75 cm), at both protected and grazed Avicennia marina mangrove locations. A t-test comparison was displayed on the graph; the middle line is the median; the top and bottom of the box are quantiles (Q1 and Q3); the error bar is the largest and smallest value; and the + is the mean.
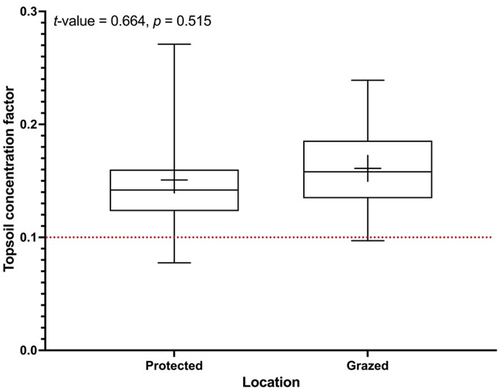
Table 6. Assessment of validation indices for volumetric SOC density (kg C/m3) using three equations in protected and grazed Avicennia marina mangrove locations
Table 7. Assessment of validation indices for cumulative SOC stock (kg C/m2) using three equations in protected and grazed Avicennia marina mangrove locations
Photo A1. Depicts camels engaging in browsing activity on Avicennia marina within grazed mangrove locations.
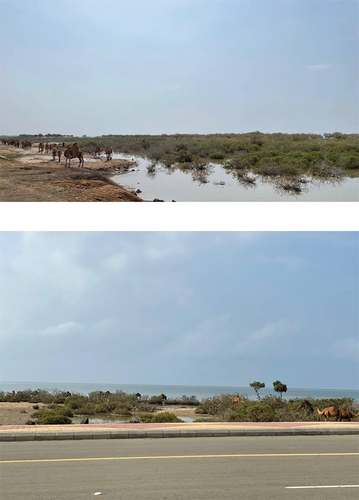
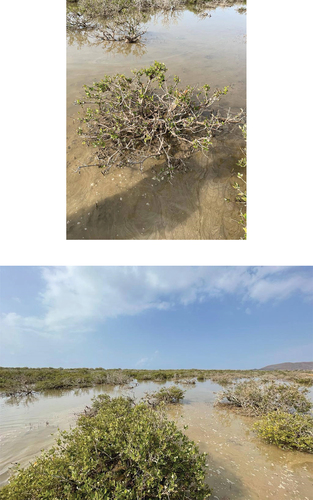
Photo A2. Presents images illustrating the effects of camel grazing on Avicennia marina within grazed mangrove locations.
Data availability statement
The data supporting the findings of this study are available upon reasonable request.