Figures & data
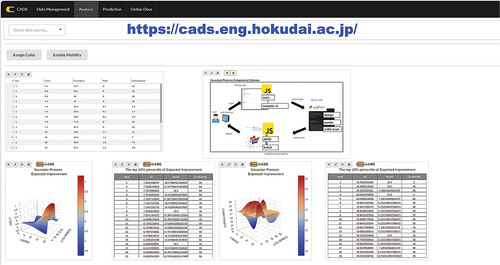
Figure 1. Architecture of CADS.
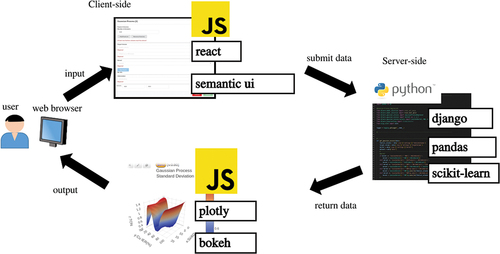
Figure 2. Graphical user interface of Gaussian process regression.
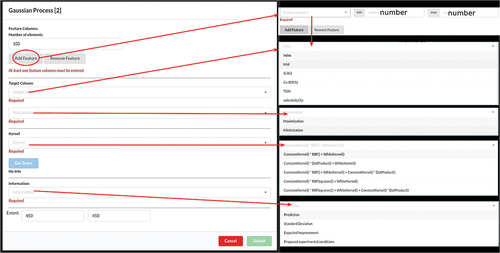
Figure 3. General work from Bayesian optimization in CADs.
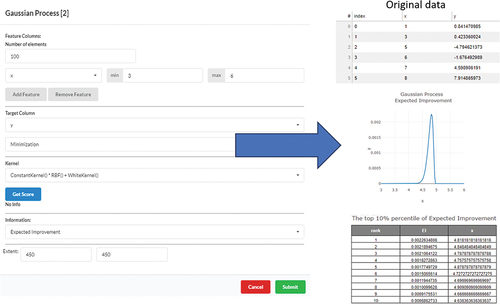
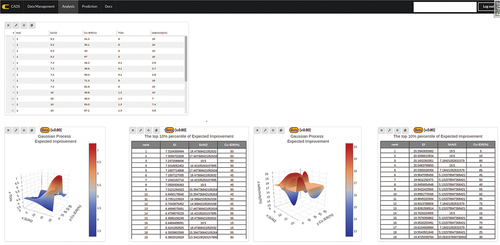
Figure 4. Case study: methanol synthesis from methane for maximizing selectivity and turnover number (TON). Si/Al ratio and Cu exchange rate are set as descriptor variables.