
Figures & data

Figure 1. Observation process of XRD data and a conceptual diagram of the proposed method, that is, Bayesian inverse estimation to identify the crystalline phase structure and their known structures for XRD analysis [Citation9].
![Figure 1. Observation process of XRD data and a conceptual diagram of the proposed method, that is, Bayesian inverse estimation to identify the crystalline phase structure and their known structures for XRD analysis [Citation9].](/cms/asset/be5a20d0-909e-401c-a603-b0bcbd0ee8a7/tstm_a_2300698_f0001_oc.jpg)
Figure 2. Supplementary diagram of the similarity calculation procedure. [(a) Observed XRD data and (b) Crystal structure factor
].
![Figure 2. Supplementary diagram of the similarity calculation procedure. [(a) Observed XRD data D and (b) Crystal structure factor Fk].](/cms/asset/a2af3eec-5271-4583-8495-a6f6e7dbc709/tstm_a_2300698_f0002_oc.jpg)
Table 1. Fifty candidate crystal structures prepared from the AtomWork [Citation17], which is the inorganic material database. Two structure types were obtained from the literature [Citation19,Citation20], respectively.
Figure 3. Selection results from 50 candidates for each temperature in the REMC method. The x- and the y-axes denote the candidate crystal structures and index of inverse temperature , respectively. This figure shows a visualization of the indicator probability
[%]. The large index corresponds to lower temperatures. The color scale denotes the sampling frequency of
on a log scale. The dark red indicates the presence of crystal structure in the measured sample.
![Figure 3. Selection results from 50 candidates for each temperature in the REMC method. The x- and the y-axes denote the candidate crystal structures and index of inverse temperature τ, respectively. This figure shows a visualization of the indicator probability P(g|Y;β=βτ) [%]. The large index corresponds to lower temperatures. The color scale denotes the sampling frequency of gk=1 on a log scale. The dark red indicates the presence of crystal structure in the measured sample.](/cms/asset/c4ec8465-731c-4771-bcd1-e76a8ef11b74/tstm_a_2300698_f0003_oc.jpg)
Figure 4. Cosine similarity between the measurement XRD data and the crystal structure factors
for prescreening. In this figure, the red line denotes the threshold value set at 0.5.
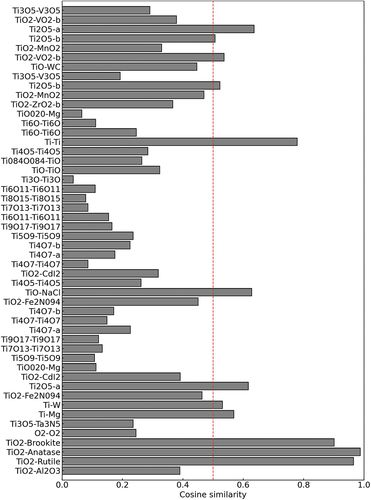
Figure 5. Selection result from 12 candidates for each temperature in the REMC method. The x- and the y-axes denote the candidate crystal structures and the index of the inverse temperature . This figure shows a visualization of the indicator probability
[%]. The large index corresponds to lower temperatures. The color scale denotes the sampling frequency of
on a log scale. The dark red color indicates the presence of crystal structures in the measured sample.
![Figure 5. Selection result from 12 candidates for each temperature in the REMC method. The x- and the y-axes denote the candidate crystal structures and the index of the inverse temperature τ. This figure shows a visualization of the indicator probability P(g|Y;β=βτ) [%]. The large index corresponds to lower temperatures. The color scale denotes the sampling frequency of gk=1 on a log scale. The dark red color indicates the presence of crystal structures in the measured sample.](/cms/asset/91740cf0-17c6-415b-bb37-e499250ab17a/tstm_a_2300698_f0005_oc.jpg)
Figure 6. Result of profile analysis in the measurement XRD data using our method [(a): Fitting result via profile function in the measurement XRD data. In this figure, the black and the red lines indicate the measurement XRD data and the fitting profile functions, respectively. (b): Peak components in three crystal structures of ; Anatase, Brookite, and rutile. The red, green, and blue lines indicate the peaks of Anatase, Brookite, and rutile, respectively].
![Figure 6. Result of profile analysis in the measurement XRD data using our method [(a): Fitting result via profile function in the measurement XRD data. In this figure, the black and the red lines indicate the measurement XRD data and the fitting profile functions, respectively. (b): Peak components in three crystal structures of TiO2; Anatase, Brookite, and rutile. The red, green, and blue lines indicate the peaks of Anatase, Brookite, and rutile, respectively].](/cms/asset/aeb70db6-68d9-4b34-9c28-4efc722a979c/tstm_a_2300698_f0006_oc.jpg)
Figure 7. Posterior distribution of the peak area ratio on the triangular diagram when analyzing the measurement XRD data using the proposed method. The units for the axes are percentages [%].
![Figure 7. Posterior distribution of the peak area ratio on the triangular diagram when analyzing the measurement XRD data using the proposed method. The units for the axes are percentages [%].](/cms/asset/e1850782-821b-401b-a20c-e563172264c0/tstm_a_2300698_f0007_oc.jpg)
Figure 8. Expanded view of the posterior distribution of the peak area ratio when analyzing the measurement XRD data using the proposed method. The units for the axes are percentages [%].
![Figure 8. Expanded view of the posterior distribution of the peak area ratio when analyzing the measurement XRD data using the proposed method. The units for the axes are percentages [%].](/cms/asset/05301a6f-d73c-47de-857b-6b67608be928/tstm_a_2300698_f0008_oc.jpg)
Figure 9. Posterior distribution of the profile parameters in the measurement XRD data. The red, green, and blue histograms correspond to the posterior distribution of Anatase, Brookite, and rutile, respectively. [(a): Peak height , (b): Peak shift
, (c): Gauss-Lorentz ratio
, and (d): asymmetry parameter
]. (e) and (f) are Gauss width
and Lorentz width
, where
is
[
]. The black dot-dash line is a true parameter of the profile function.
![Figure 9. Posterior distribution of the profile parameters in the measurement XRD data. The red, green, and blue histograms correspond to the posterior distribution of Anatase, Brookite, and rutile, respectively. [(a): Peak height h, (b): Peak shift μ, (c): Gauss-Lorentz ratio r, and (d): asymmetry parameter α]. (e) and (f) are Gauss width Σ(xi;uk,vk,wk,αk) and Lorentz width Ω(xi;uk,vk,wk,αk), where xi is 2θ=60 [ ∘]. The black dot-dash line is a true parameter of the profile function.](/cms/asset/151977f7-343c-4979-b82c-7805c81cc0cf/tstm_a_2300698_f0009_oc.jpg)
Figure 10. Selection result for each temperature in the REMC method in case-01. The x- and the y-axes denote the candidate crystal structures and the index of the inverse temperature . This figure shows a visualization of the indicator probability
[%]. The large index corresponds to lower temperatures. The color scale denotes the sampling frequency of
on a log scale. The dark red color indicates the presence of crystalline phase structures in the measured sample.
![Figure 10. Selection result for each temperature in the REMC method in case-01. The x- and the y-axes denote the candidate crystal structures and the index of the inverse temperature τ. This figure shows a visualization of the indicator probability P(g|Y;β=βτ) [%]. The large index corresponds to lower temperatures. The color scale denotes the sampling frequency of gk=1 on a log scale. The dark red color indicates the presence of crystalline phase structures in the measured sample.](/cms/asset/7a84873a-00ba-4828-bb0f-87c2cb7934b4/tstm_a_2300698_f0010_oc.jpg)
Figure 11. Selection result for each temperature in the REMC method in case-02. The x- and the y-axes denote the candidate crystal structures and the index of inverse temperature . This figure shows a visualization of the indicator probability
[%]. The large index corresponds to lower temperatures. The color scale denotes the sampling frequency of
on a log scale. The dark red color indicates the presence of crystalline phase structures in the measured sample.
![Figure 11. Selection result for each temperature in the REMC method in case-02. The x- and the y-axes denote the candidate crystal structures and the index of inverse temperature τ. This figure shows a visualization of the indicator probability P(g|Y;β=βτ) [%]. The large index corresponds to lower temperatures. The color scale denotes the sampling frequency of gk=1 on a log scale. The dark red color indicates the presence of crystalline phase structures in the measured sample.](/cms/asset/f26a138f-da89-4a12-8e72-67ffb53ee704/tstm_a_2300698_f0011_oc.jpg)
Table 2. Cell lattice parameters of and rutile crystal structure types in
[Citation19,Citation21].
Figure B1. Result of profile analysis in case-01 using our method [(a): Fitting result via profile function in the measurement XRD data. The black and the red lines represent the measurement XRD data and the fitting profile function, respectively. (b): Peak components in two crystal structures of ; Anatase and rutile. The red and blue lines denote peaks of Anatase and rutile, respectively].
![Figure B1. Result of profile analysis in case-01 using our method [(a): Fitting result via profile function in the measurement XRD data. The black and the red lines represent the measurement XRD data and the fitting profile function, respectively. (b): Peak components in two crystal structures of TiO2; Anatase and rutile. The red and blue lines denote peaks of Anatase and rutile, respectively].](/cms/asset/a18f271c-98db-4f73-9f65-b4f1ebae9ec4/tstm_a_2300698_f0012_oc.jpg)
Table B1. True parameter of profile function in artificial data. We assumed that the XRD data were measured on a sample containing three crystalline phase structures of : Anatase, Brookite, and rutile.
Figure B2. Selection result from 50 candidates for each temperature using the REMC method for artificial XRD data. The x- and the y-axes denote the candidate crystal structures and the index of the inverse temperature . This figure shows a visualization of the indicator probability
[%]. The large index corresponds to lower temperatures. The color scale denotes the sampling frequency of
on a log scale. The dark red indicates the presence of the crystal structure in the measured sample.
![Figure B2. Selection result from 50 candidates for each temperature using the REMC method for artificial XRD data. The x- and the y-axes denote the candidate crystal structures and the index of the inverse temperature τ. This figure shows a visualization of the indicator probability P(g|Y;β=βτ) [%]. The large index corresponds to lower temperatures. The color scale denotes the sampling frequency of gk=1 on a log scale. The dark red indicates the presence of the crystal structure in the measured sample.](/cms/asset/109db692-ce6d-4565-838b-7259fe6490c2/tstm_a_2300698_f0013_oc.jpg)
Figure B3. Result of profile analysis in the artificial data using our method [(a): Fitting result via profile function in the artificial data. In this figure, the black and the red lines indicate the artificial data and the fitting profile function, respectively. (b): Peak components in three crystal structures of : Anatase, Brookite, and rutile. The red, green, and blue lines indicate peaks of Anatase, Brookite, and rutile, respectively].
![Figure B3. Result of profile analysis in the artificial data using our method [(a): Fitting result via profile function in the artificial data. In this figure, the black and the red lines indicate the artificial data and the fitting profile function, respectively. (b): Peak components in three crystal structures of TiO2: Anatase, Brookite, and rutile. The red, green, and blue lines indicate peaks of Anatase, Brookite, and rutile, respectively].](/cms/asset/ffde860b-0b2a-433c-82dc-c95de7194cd5/tstm_a_2300698_f0014_oc.jpg)
Figure B4. Posterior distribution of the profile parameters in the artificial data. The red, green, and blue histograms are the posterior distribution of Anatase, Brookite, and rutile, respectively. [(a): Peak height , (b): peak shift
, (c): Gauss-Lorentz ratio
, and (d): asymmetry parameter
]. (e) and (f) are Gauss width
and Lorentz width
, where
is
[degree]. The black dot-dashed line denotes the true parameter of the profile function.
![Figure B4. Posterior distribution of the profile parameters in the artificial data. The red, green, and blue histograms are the posterior distribution of Anatase, Brookite, and rutile, respectively. [(a): Peak height h, (b): peak shift μ, (c): Gauss-Lorentz ratio r, and (d): asymmetry parameter α]. (e) and (f) are Gauss width Σ(xi;uk,vk,wk,αk) and Lorentz width Ω(xi;uk,vk,wk,αk), where xi is 2θ=60 [degree]. The black dot-dashed line denotes the true parameter of the profile function.](/cms/asset/f622061b-9c68-44be-9b48-01b7bb3f2211/tstm_a_2300698_f0015_oc.jpg)
Figure B5. Result of profile analysis in case-02 using our method [(a): Fitting result via profile function in the measurement XRD data. The black and red lines denote the measurement XRD data and the fitting profile function, respectively. (b): Peak components in two crystal structures of ; Anatase and Brookite. The red and green lines denote peaks of Anatase and Brookite, respectively].
![Figure B5. Result of profile analysis in case-02 using our method [(a): Fitting result via profile function in the measurement XRD data. The black and red lines denote the measurement XRD data and the fitting profile function, respectively. (b): Peak components in two crystal structures of TiO2; Anatase and Brookite. The red and green lines denote peaks of Anatase and Brookite, respectively].](/cms/asset/60450e9f-9711-4d10-9392-7c75bd6b2c98/tstm_a_2300698_f0016_oc.jpg)