Figures & data

Figure 1. Chart shows the quantity of research publications studied in this paper, organized by the year of publication and the first author’s country.
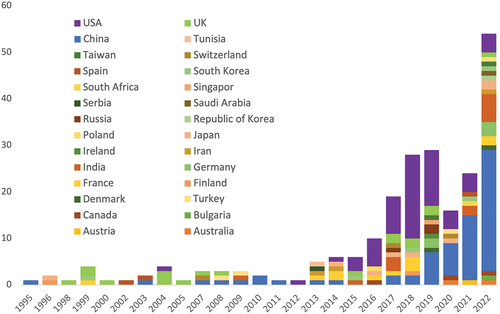
Figure 2. Pie chart displaying the proportion of publications in different peer-review journals that were studied in this research.
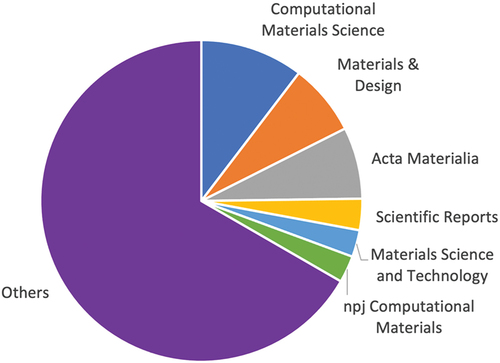
Figure 3. Sankey diagram with countries on the left side and studied alloys by ML on the right side.
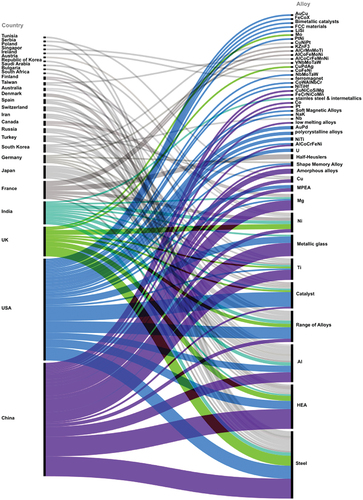
Figure 4. The Sankey diagram with the countries on the left side, predicted parameters in the middle and studied alloys on the right side.
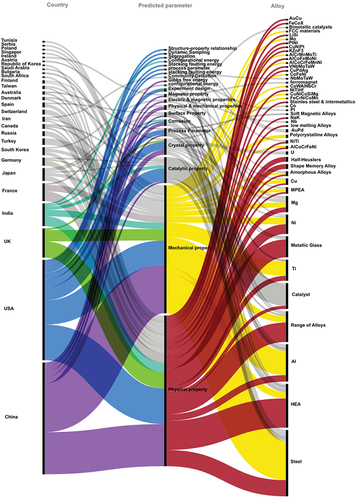
Figure 5. The Sankey diagram represents the associations between predicted properties (on the left side) and the corresponding ML models employed in the analysis, as evident from the collected publications (on the right side). The figure provides insights into the distribution and utilization of ML models for predicting specific properties in the context of the collected publications.
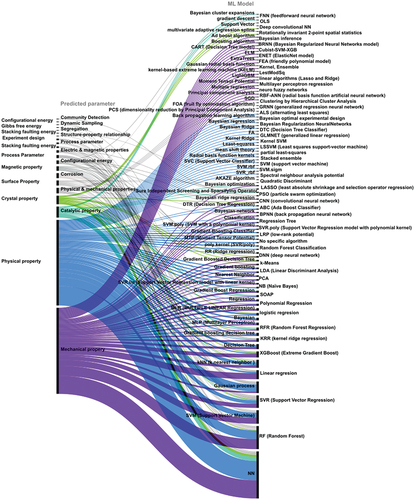
Table 1. Known data repositories of metals and used in the collected papers.
Figure 6. Sankey diagram with ML models on the left side and the studied alloys on the right side. The diagram is an illustration of the relationship between the ML model and predicted alloys.
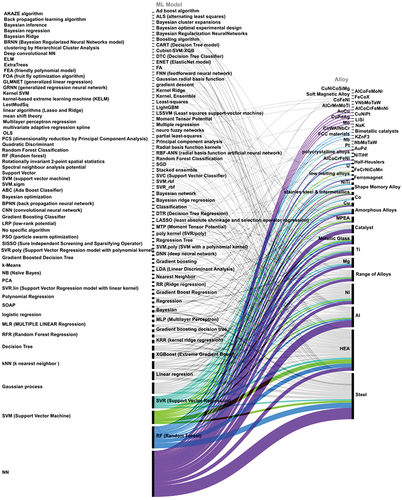
Table 2. Pros and cons of some of ML models [Citation85,Citation112,Citation148,Citation209,Citation220].
Figure 7. The pie chart illustrates the frequency of ML model usage within a single published paper. For example, one paper used 12 ML models in one published paper while the majority of papers used only one ML model.
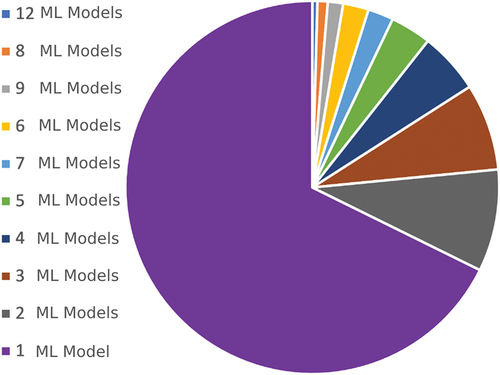
Figure 8. Sankey diagram with predicted parameters on the left side and the best-suggested ML models on the right side. The diagram is an illustration of the relationship between the predicted property and the alloy of the best-suggested ML model for predicted properties. This graph is not showing all of the studied papers. It is only showing the results of those papers that compared different ML models and reported the best ML model.
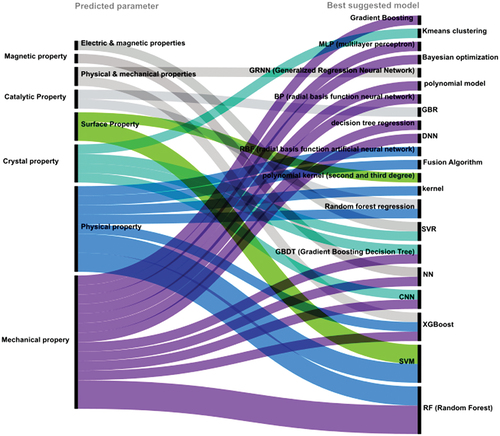
Figure 9. Building a data flywheel for ML modelling: (1) data collection, (2) Exploratory Data Analysis (EDA), (3) data cleaning/preprocessing, (4) feature engineering, (5) training an ML model, (6) optimization through hyperparameter tuning, (7) testing and validation of the best ML model, (8) Model deployment for production, (9) evaluation of the accuracy and the quality of final predictions, (10) data re-checking and re-evaluation. Steps 8–10 are usually missed or neglected in most of the published works.
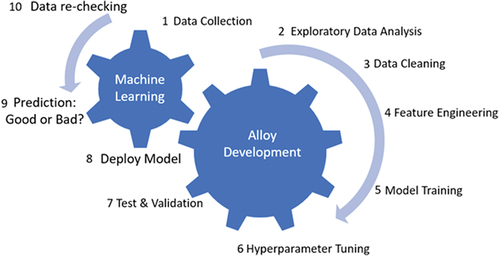
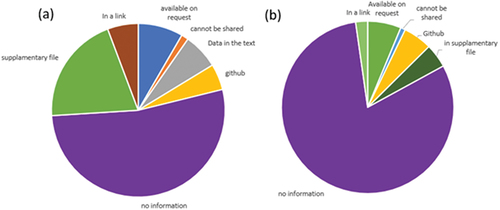
Figure 10. Pie charts showing (a) data availability and (b) code availability, in the studied publications. The figures provide insights into how often data and code are shared within the research community have implications for the transparency and reproducibility of the research.