
Figures & data
Figure 1. Three-step workflow described in the present study. Capital italic name expresses each detailed procedure, CIF2ESC: conversion from a CIF file to electronic-structure-calculation data with output of fingerprint as structure feature for post structure analyses; DISTANCE: evaluation of distances between structure feature vectors; DISTANCE_DISTRIBUTION: calculation of distance distribution; DIAGNOSIS: extraction of inequivalent structures; CMDS: classical multidimensional scaling; PCEV: calculation of principal component eigenvectors; PROJECTION: projection of an arbitrary structure on the dimension-reduced map; ATLS: generation of atom-type list; FINDSYM: space-group finder
: Ref [Citation15,Citation16]. Open and solid (and dotted) arrows denote data transfers between the steps and inside each step, respectively. Dotted arrow is applicable if necessary.
![Figure 1. Three-step workflow described in the present study. Capital italic name expresses each detailed procedure, CIF2ESC: conversion from a CIF file to electronic-structure-calculation data with output of fingerprint as structure feature for post structure analyses; DISTANCE: evaluation of distances between structure feature vectors; DISTANCE_DISTRIBUTION: calculation of distance distribution; DIAGNOSIS: extraction of inequivalent structures; CMDS: classical multidimensional scaling; PCEV: calculation of principal component eigenvectors; PROJECTION: projection of an arbitrary structure on the dimension-reduced map; ATLS: generation of atom-type list; FINDSYM ∗: space-group finder ∗: Ref [Citation15,Citation16]. Open and solid (and dotted) arrows denote data transfers between the steps and inside each step, respectively. Dotted arrow is applicable if necessary.](/cms/asset/3f862b2b-a1c2-4ad0-8c70-da4a5d33f2f9/tstm_a_2355860_f0001_b.gif)
Table 1. List of AlO
structures in the order of calculated total energy
(meV/atom) relative to the most stable
structure, and the energy gap
(eV). Figures in parentheses are values given in the materials project site [11]. Color scheme is used for distinguishing different structures in .
Figure 2. F-Fingerprint of all the AlO
systems listed in except for the 2D film model. Radius cutoff
Å is assumed and the fingerprint of dimensions between 0 and 100, 101 and 200, and 201 and 300 corresponds to O-O, O-Al, and Al-Al pairs, respectively. Line colors follow color scheme in Table 1 for distinguishing different structures.
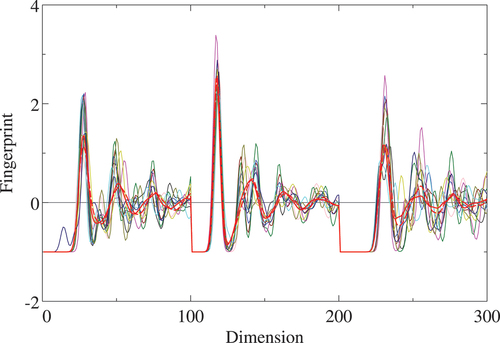
Figure 3. Eigenvalues calculated from the fingerprint of AlO
polymorphs using (a)
Å and (b)
Å with Euclidean (blue) and cosine (red) distances.
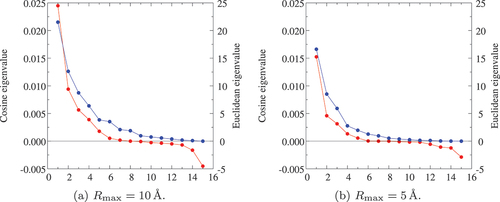
Figure 4. Map of AlO
structures with the five principal components (PCs) with (a) Euclidean-distance
Å, (b) cosine-distance
Å, (c) Euclidean-distance
Å, and (d) cosine-distance
Å. Dot colors follow color scheme listed in . Square dots in each figure denote the three lowest energy structures (SG:
(black),
(maroon), and
(blue)), and small and large red dots express amorphous model structures (SG:
) by the materials project [Citation11] and momida [Citation43], respectively.
![Figure 4. Map of Al 2O 3 structures with the five principal components (PCs) with (a) Euclidean-distance Rmax=10 Å, (b) cosine-distance Rmax=10 Å, (c) Euclidean-distance Rmax=5 Å, and (d) cosine-distance Rmax=5 Å. Dot colors follow color scheme listed in Table 1. Square dots in each figure denote the three lowest energy structures (SG: R3ˉc (black), C2/m (maroon), and Pna21 (blue)), and small and large red dots express amorphous model structures (SG: P1) by the materials project [Citation11] and momida [Citation43], respectively.](/cms/asset/95d8b270-b3fc-4290-b32a-f048af2e6be4/tstm_a_2355860_f0004_oc.jpg)
Figure 5. Eigenvector of the five principal components (PCs) with (a) Euclidean-distance Å, (b) cosine-distance
Å, (c) Euclidean-distance
Å, and (d) cosine-distance
Å, calculated by using EquationEquation (17)
(17)
(17) in Al
O
polymorphs. Red, lime, blue, maroon, and green lines denote
,
,
,
, and
PC, respectively. Horizontal axis denotes the dimension of the original fingerprint space (see ). In (a) and (b), the dimensions between 1 and 100, 101 and 200, and 201 and 300 express the O-O, O-Al, and Al-Al pair radius, respectively, and in (c) and (d), the dimensions between 1 and 50, 51 and 100, and 1001 and 150 do the O-O, O-Al, and Al-Al pair radius, respectively.
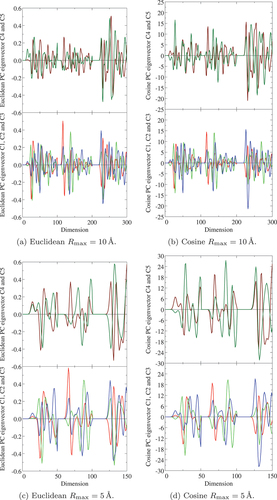
Figure 6. Regression analysis of the total energy with descriptors up to the second order of the five PCs in AlO
polymorph structures. (a) Euclidean-distance
Å, (b) cosine-distance
Å, (c) Euclidean-distance
Å, and (d) cosine-distance
Å. Blue, red, and green dots and lines denote the coefficient of determination (
), its leave-one-out coefficient (
), and root mean square error (RMSE), respectively.
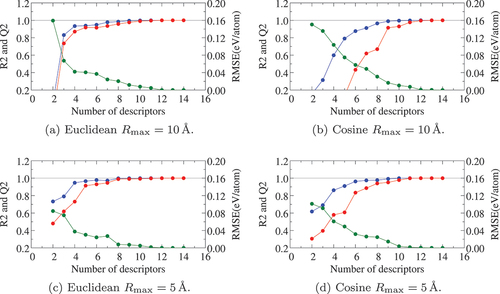
Figure 7. Double cross-validation test of the total-energy regression model constructed with the descriptors from the Euclidean distance and Å in Al
O
polymorph structures. Dot colors follow color scheme listed in . Red open circle denotes one of the amorphous structure (mp -1,245,063). The model of the number of descriptors of eight shows the smallest standard deviation (
0.1 eV).
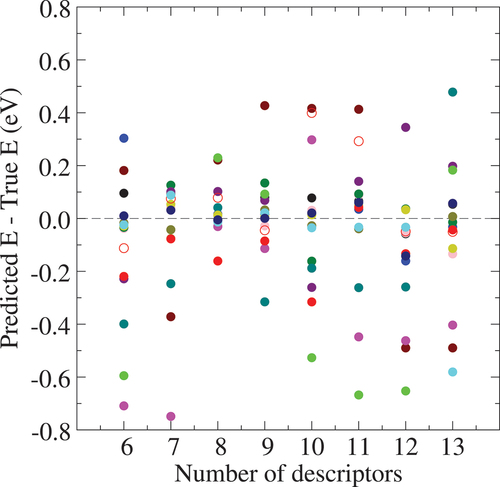
Figure 8. Crystal structure of LaFe
Si
. Green, orange, and brown balls denote La, Fe1 and Fe2 atomic sites, respectively. Partial occupation of Si at the Fe2 sites is depicted with blue. The drawing is made with VESTA [Citation9].
![Figure 8. Crystal structure of La 2Fe 26−ySi y. Green, orange, and brown balls denote La, Fe1 and Fe2 atomic sites, respectively. Partial occupation of Si at the Fe2 sites is depicted with blue. The drawing is made with VESTA [Citation9].](/cms/asset/c692dc0d-6af6-4472-9e52-9b01d2617856/tstm_a_2355860_f0008_oc.jpg)
Figure 9. Heats of formation in eV/atom (EquationEquation (22)
(22)
(22) ) and
in meV/atom (EquationEquation (23)
(23)
(23) ), and spin magnetic moments in
per Fe atom calculated for La
Fe
Si
. Red dots, green dots, and blue circles denote values for the configurations with Si occupying at only
, at
and
, and at only
, respectively. Black dots indicate the corresponding values for La
Fe
.
![Figure 9. Heats of formation H in eV/atom (EquationEquation (22)(22) H(y;i)=128{E[La2Fe26−ySiy;i]−2E[La] −(26−y)E[Fe]−yE[Si]}(22) ) and ΔH in meV/atom (EquationEquation (23)(23) ΔH(y;i)=H(y;i)−minjH(y;j)(23) ), and spin magnetic moments in μB per Fe atom calculated for La 2Fe 26−ySi y. Red dots, green dots, and blue circles denote values for the configurations with Si occupying at only 8b, at 8b and 96i, and at only 96i, respectively. Black dots indicate the corresponding values for La 2Fe 26(y=0).](/cms/asset/4d6d57dc-1c0b-48d0-b677-6af56fa267a7/tstm_a_2355860_f0009_oc.jpg)
Figure 10. (a) -fingerprints and (b) Euclidean eigenvectors of three principal components of Si-Si (0–80) and Fe-Si (80–160) dimensions of La
Fe
Si
(Case 2–3). Line colors used for the
-fingerprints in (a) correspond to those of dots in . Red, lime, and blue lines in (b) denote the eigenvectors of
,
, and
, respectively.
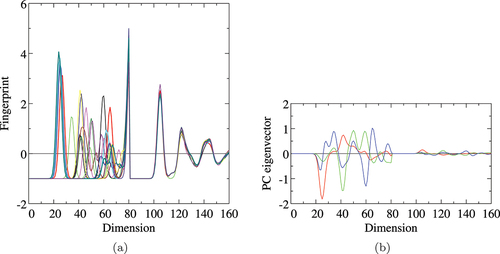
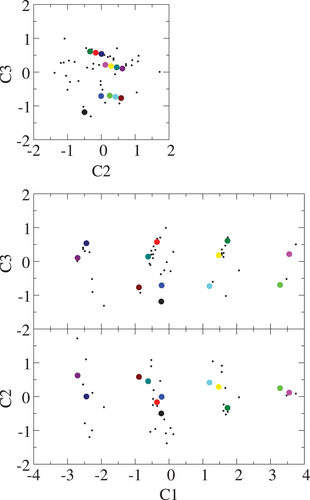
Figure 11. Structure map of LaFe
Si
(case 2–3) obtained by dimension reduction of the Euclidean distance. Dot colors denote the different configurations corresponding to the
-fingerprint shown in ).
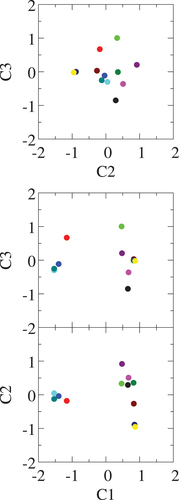
Figure 12. (a) Selected -fingerprints and (b) eigenvectors of three principal components of Si-Si (0–80) and Fe-Si (80–160) dimensions of La
Fe
Si
(case 3–3). Red, lime, and blue lines in (b) denote the eigenvectors of
,
, and
, respectively.
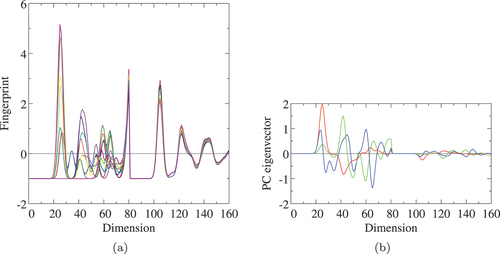
Figure 13. Structure map of LaFe
Si
(case 3–3) obtained by dimension reduction of the Euclidean distance. Dot colors denote the different configurations corresponding to the
-fingerprint shown in ), where the
-fingerprints of the small black dots here are not included.
Data availability statement
The raw data required to reproduce these findings are available by making an e-mail request to the corresponding author.