
Figures & data
Figure 1. Illustration of plain strain creep consolidometer
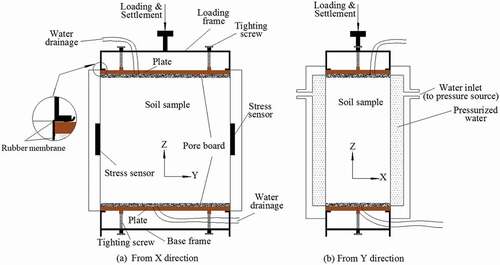
Figure 2. Photos of the test process
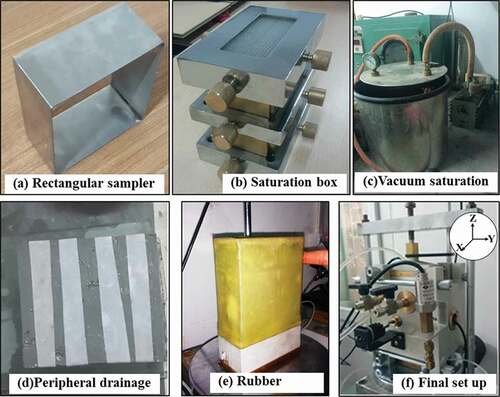
Table 1. Basic soil properties of Yuedong clay
Table 2. Detailed steps for reloading
Figure 3. Comparison of stress in zero strain direction (σy) under normal and over-consolidation states
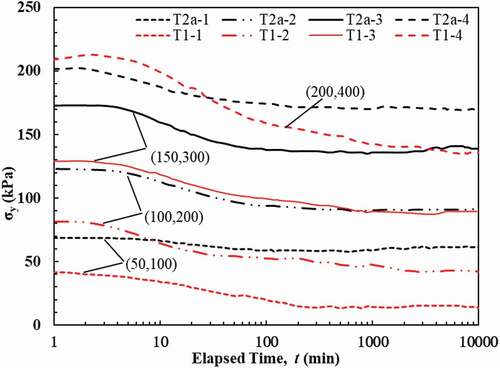
Figure 4. Variations of σy with time for OC soils in test 2a, b and c
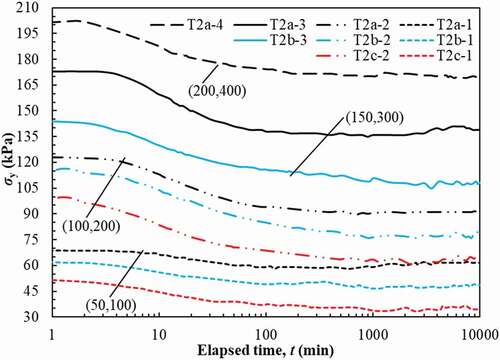
Figure 5. Variations of σy with time for OC soils in test 3a, b and c
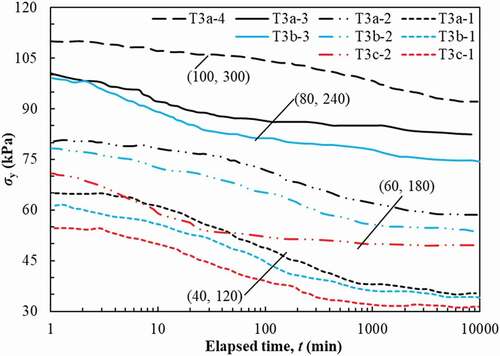
Figure 6. Relationship between final σy and (a) σz, (b) σx for K = 0.5
Figure 7. Relationship between final σy and (a) σz, (b) σx for K = 0.33
Figure 8. Variations of volumetric strain with time for tests T1 and T2 (a, b, c)
Table 3. Calculated results of volumetric creep coefficient and volumetric stress defined over-consolidation ratio
Table 4. Calculated results of vertical creep coefficient and volumetric stress defined over-consolidation ratio
Figure 9. Graphic procedure for determining Cα: plot the εv ~ log (t) curve firstly, project a straight line along the final linear part of the εv ~ log (t) curve secondly, and calculate the slope of the straight line finally
Figure 10. Vertical creep coefficient β for OC clay under plain strain and 1D condition
Figure 11. (a) Cα and (b) β as a function of OCRP.
Figure 12. (a) Cα and (b) β as a function of K∙OCRP.
Data availability statement
The data that support the findings of this study are available from the corresponding author, Y. Zhou, upon reasonable request.