Figures & data
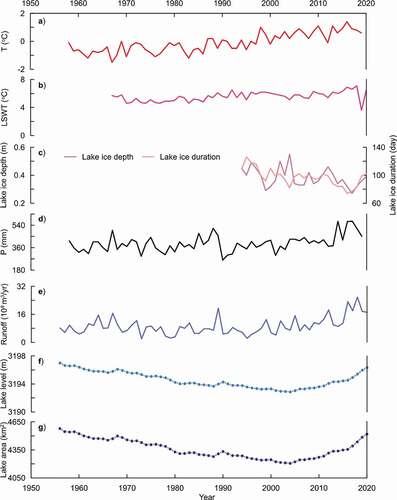
Figure 1. Schematic illustrating climate change effects on lake variations over the Tibetan Plateau
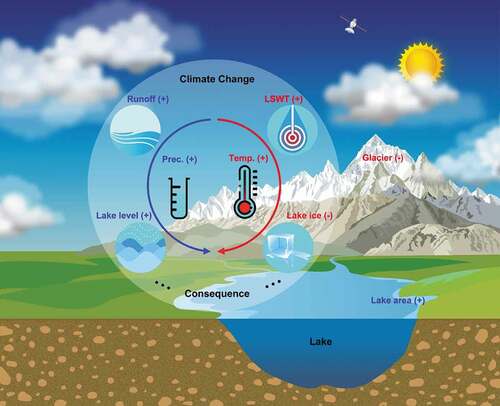
Figure 2. Warmer and wetter climate driving lake change, with Qinghai Lake as a case study, from 1956 to 2020. a) Air temperature (T) observed at Gangcha station from 1958 to 2019. b) Lake surface water temperature (LSWT) at Xiashe station from 1967 to 2020. c) Lake ice depth and lake ice duration at Xiashe station from 1994 to 2020. d) Precipitation (P) at Gangcha station from 1958 to 2019. e) Runoff at Buha station from 1956 to 2020. f) Lake level at Xiashe station from 1956 to 2020. g) Lake area from 1956 to 2020 estimated from the correlation constructed between lake area derived from Landsat images and lake level from gauge measurements in 2001 − 2020. The locations of stations are shown in Figure S2 in the supporting information. The correlation between lake area and level is shown in Figure S3