
Figures & data
Figure 1. Study area showing the gauge stations and the corresponding meteorological stations (the numbers and characters are referred to ).
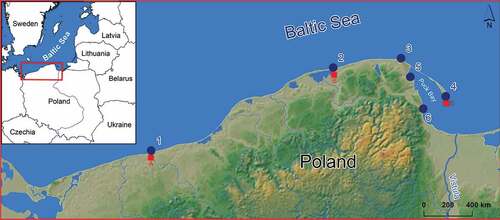
Table 1. The studied gauge stations and the corresponding meteorological stations (Designation according to ).
Figure 2. Time series data of daily sea surface temperature (SST) and air temperature (Ta) for the six studied stations: (1) Kołobrzeg, (2) Łeba, (3) Władysławowo, (4) Hel, (5) Puck, and (6) Gdynia.
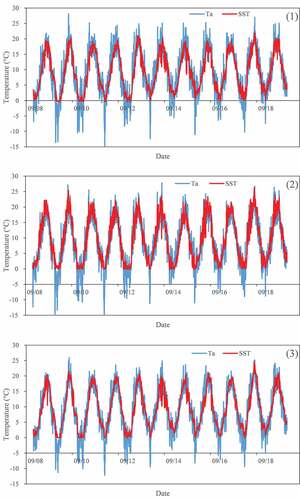
Figure 2. (Continued).
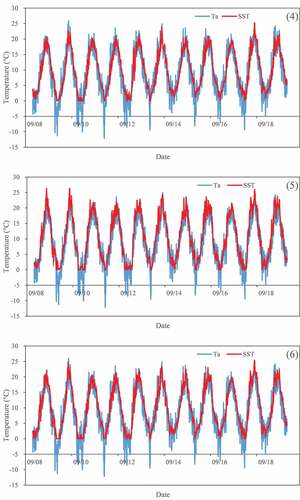
Figure 3. Trend analysis of annual average sea surface temperature (SST) and air temperature (Ta) for the six studied stations: (1) Kołobrzeg, (2) Łeba, (3) Władysławowo, (4) Hel, (5) Puck, and (6) Gdynia.
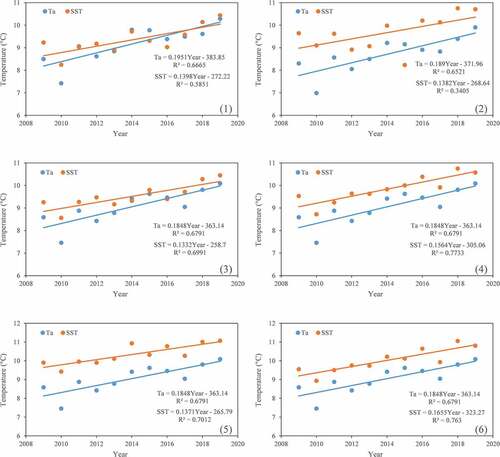
Table 2. Summary of the parameter values for the studied stations.
Figure 4. Box plots showing the modelled and observed sea surface temperature (SST) values for the validation period (2017–2019) at the six studied stations: (1) Kołobrzeg, (2) Łeba, (3) Władysławowo, (4) Hel, (5) Puck, and (6) Gdynia.
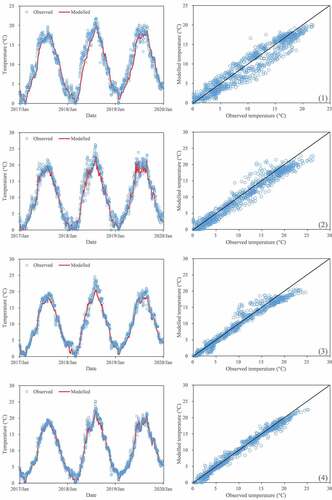
Figure 4. (Continued).
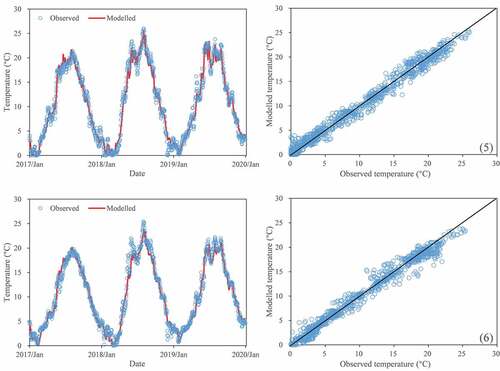
Table 3. Summary of the modelling results for the studied stations.
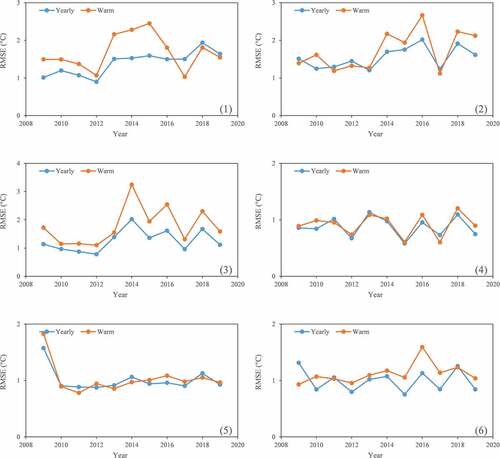
Figure 5. RMSE values for each year (Yearly) and warm period (June–September) at the six studied stations: (1) Kołobrzeg, (2) Łeba, (3) Władysławowo, (4) Hel, (5) Puck, and (6) Gdynia.
Data Availability Statement
The data used in this study are available upon request from the corresponding author. https://github.com/slzhu1989?tab=repositories