
Figures & data
Figure 1. Changes between 1992–2019 in: global temperature anomalies relative to the 1901–2000 and 1951–1980 base periods (a); total greenhouse gases (GHGs, in carbon dioxide equivalent (CO2e)) emission (b); and CO2e concentration (c).
Data source for the 1901-2000 base period: https://www.ncdc.noaa.gov/cag/global/time-series, data source for the 1951-1980 base period: https://climate.nasa.gov/vital-signs/global-temperature/(a); Data source: https://ourworldindata.org/greenhouse-gas-emissions (b); Data source: https://gml.noaa.gov/aggi/aggi.html
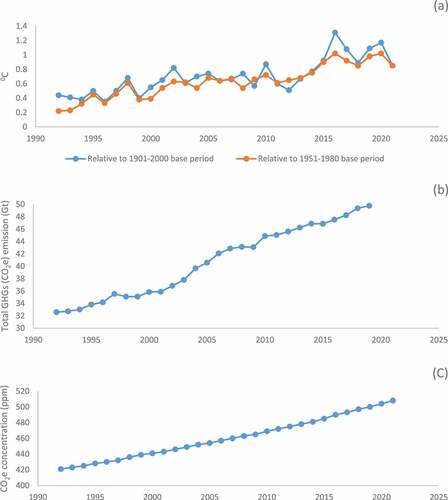
Figure 2. Changes in atmospheric concentrations of carbon dioxide (CO2: a), methane (CH4: b), and nitrous oxide (N2O: c) between 1992–2021.
Data source: https://www.statista.com/statistics/1091926/atmospheric-concentration-of-co2-historic/ (a); Data source: https://www.eea.europa.eu/data-and-maps/daviz/atmospheric-concentration-of-carbon-dioxide-5#tab-chart_5_filters=%7B%22rowFilters%22%3A%7B%7D%3B%22columnFilters%22%3A%7B%22pre_config_polutant%22%3A%5B%22CH4%20ppb%22%5D%7D%7D (b); Data source: https://www.eea.europa.eu/data-and-maps/daviz/atmospheric-concentration-of-carbon-dioxide-5#tab-chart_5_filters=%7B%22rowFilters%22%3A%7B%7D%3B%22columnFilters%22%3A%7B%22pre_config_polutant%22%3A%5B%22N2O%20ppb%22%5D%7D%7D (c)
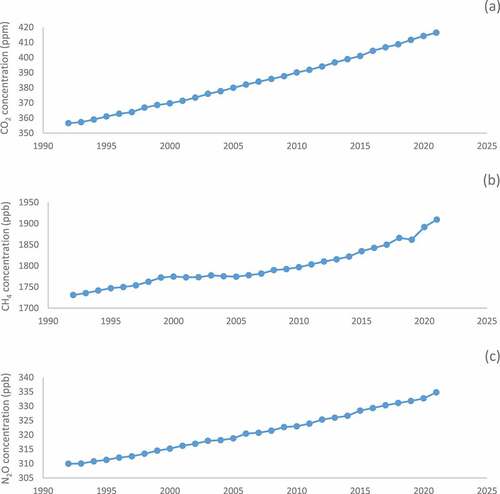
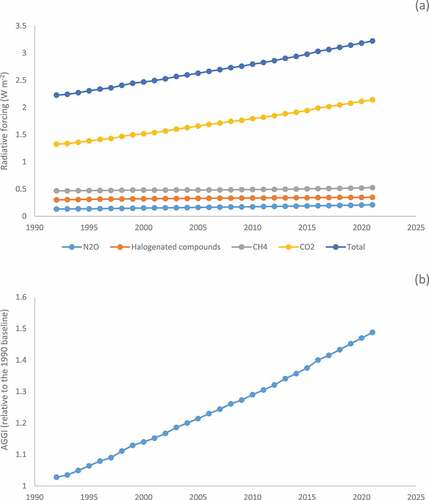
Figure 3. Changes in radiative forcing (a), and annual greenhouse gas index (AGGI) relative to the 1990 baseline (b), between 1992–2021.
Data source: https://gml.noaa.gov/aggi/aggi.html
Data availability statement
The author confirms that the data supporting this study are available within the article. No proprietary datasets were used in this article.