Figures & data
Figure 1. Seismicity map of study area, representing three major regions (solid boundaries) of study; Shillong–Mikir Hills, Arunachal Himalaya and Assam Foredeep, where the probabilistic hazard analysis is made. The major geological structures (faults & folds) are represented by black dotted lines with abbreviations represents as. MBT: Main Boundary Thrust, MCT: Main Central thrust, MFT: Main Frontal Thrust, ITSZ: Indus-Tsangpo Suture Zone, KF: Kopili Fault, DF: Dudhnoi Fault, DAUKI.F: Dauki Fault, BF: Brahmaputra Fault, CMF: Churachandpur Mao Fault, DF: Dapsi Thrust, Du. F, Dudhnoi Fault, OF: Oldham Fault, BS: Barapani Shear Zone, LT: Lohit Thrust, MT, Mishmi Thrust, and WT: Walong Thrust. Circular sub-regions selected within the Shillong–Mikir Plateau (Sregion1, Sregion2) and Arunachal Himalaya (Sregion3 and Sregion4) for temporal distribution analysis of b-value are shown by red circles. The dashed line (black colour) represents the E-W cross-section (AB) drawn in the Arunachal Himalaya region for the micro-seismic clusters’ interaction analysis.
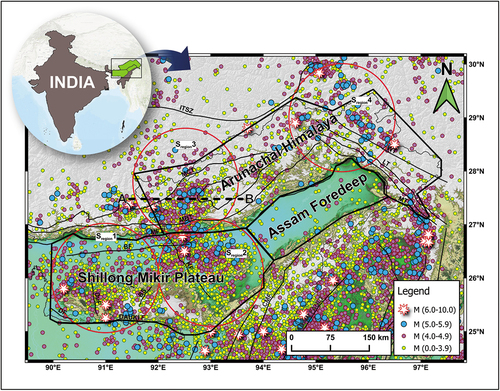
Figure 2. Frequency-magnitude Distribution (FMD) of earthquakes database for the regions (a) Shillong–Mikir Plateau, (b) Arunachal Himalaya, and (c) Assam Foredeep. The straight line (red colour) is the best fit line by maximum likelihood analysis of events. The threshold magnitude, Mc, is shown by the triangle. The average b-value is shown with the standard deviation.
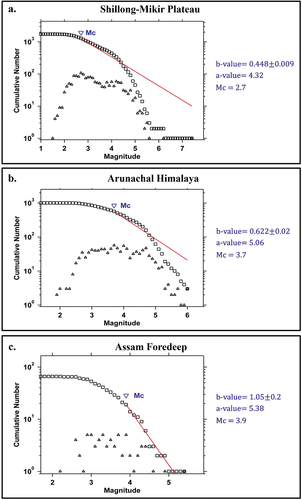
Figure 3. a. The spatial distribution of b-value for the entire study area; b. The resolution map, the area with high resolution is shown by blue color. Epicenters of large earthquakes () are shown by yellow star marks.
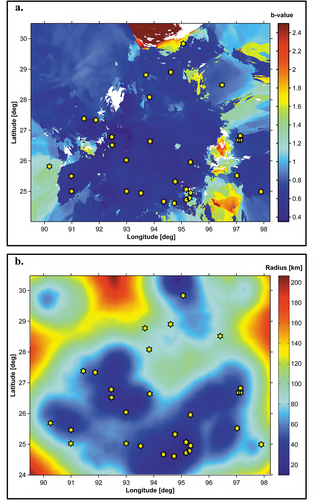
Table 1. List of large earthquakes (M ≥ 6) including some historical events and their epicenters (Lat, Lon) in the study area are presented below.
Table 2. ‘b-value for the consecutive two periods; first period (1900–1999) and second period (2000–2022).
Figure 4. Temporal variation of b-value for three regions; Shillong–Mikir Plateau, Arunachal Himalaya and Assam-Foredeep. Left side panel of the figure (a and c) shows the distributions for b-value for the period 1900–1999 and the right-side panel with figures (b and d) shows the distribution for the period 2000–2022 for the Shillong and Arunachal region, respectively. Due to low seismicity in the Assam-Foredeep region, temporal distribution is evaluated only for the period 1900–2022, without any divisions in time periods. The major drop in b-values are shown by arrow marks (red colour).
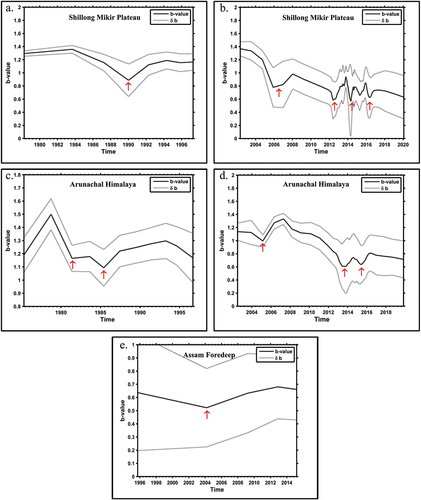
Table 3. List of large earthquakes (M ≥ 5.5) in the region of Shillong-Mikir Plateau. As temporal variation of ‘b-value' changes significantly due to large earthquakes, the scenario of these large events are represented below.
Table 4. List of large earthquakes (M ≥ 5.5) in the Arunachal Himalaya region.
Figure 5. Spatial variation of b-values for the three regions; Shillong–Mikir Plateau, Arunachal Himalaya and Assam-Foredeep. The distributions for b-value for the periods 1900–1999 are shown in the left side panels of the figure (Figures 5a and 5c), whereas the distributions for the periods 2000–2022 are shown in the right-side panels of the figure (Figs. 5b and 5d), respectively, for the Shillong–Mikir Plateau and Arunachal Himalaya regions. The temporal distribution for Assam Foredeep region is evaluated only for the period 1900–2022, with no divisions in time period, because of minimal seismic activities in the region.
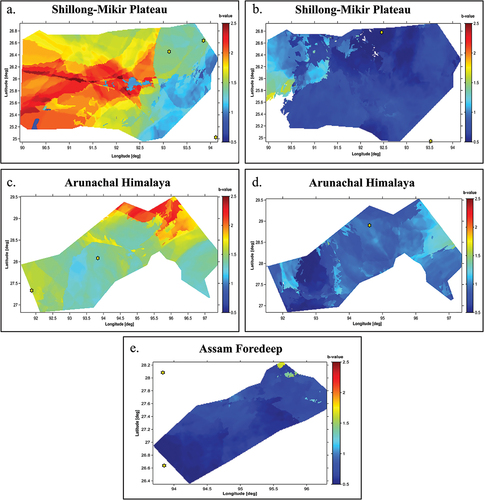
Figure 6. Scenario of temporal variations of large events, where the analysis is performed around four coordinates within the study area and then determined the temporal variations of b-value for the events within a radius of ~120 km range. Figures (a) & (b) show the temporal distribution for Shillong–Mikir Plateau region (Sregion1 and Sregion2) and figures (c) & (d) are for Arunachal Himalaya region (Sregion3 and Sregion4), respectively. Large events () are shown by star marks (yellow colour). The respective peak values of ‘b’ are marked by inverted triangles and the areas associated with major deviation of b-value are shown by red circle. The corresponding changes in b-values (δb) of clusters are marked by arrows.
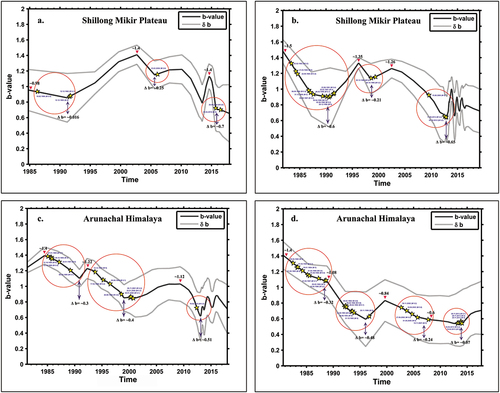
Table 5. Temporal changes of b-value in four sub-regions of interest.
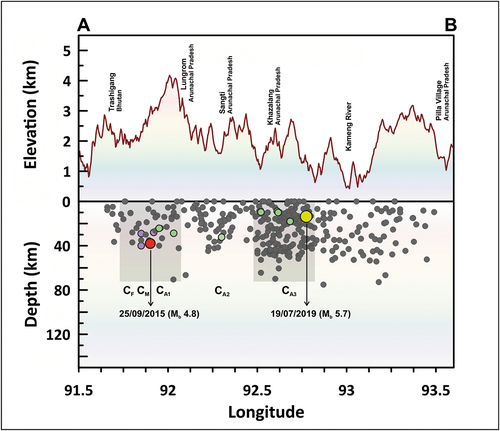
Figure 7. An E-W Event-depth section over the Arunachal Himalaya region, across the profile AB (). The red dot corresponds to the epicentre of 2015 (Mb ~ 4.8) event (CM, the main event of a cluster) in the west. The yellow dot corresponds to the epicentre of the 2019 (Mb 5.7) event in the east, which is the treated as the major event as a consequence of the cluster of previous events. The micro-seismic clusters under consideration are shown by rectangular shadow and the corresponding foreshocks (CF) and aftershocks (CA1, CA2, CA3) are shown by purple and green colour, respectively. Notice three aftershock sequences that have moved from E-W direction, which took place in different time frames: CA1 (during 2015), CA2 (during 2016), and CA3 (from 2017 to 2019).