
Figures & data
Figure 1. Location of the study area.
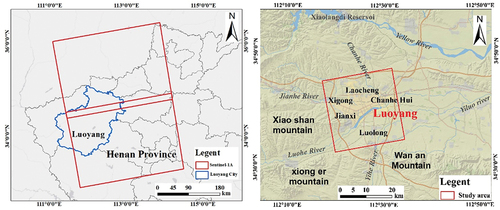
Table 1. SAR data parameters.
Figure 2. Flow chart of the experiment.
Figure 3. (A) time-position of interferometric pairs, (b) time-baseline of interferometric pairs. The orange diamond denotes the super master image. Grey lines represent interferometric pairs. Darkcyan diamonds denote slave images.
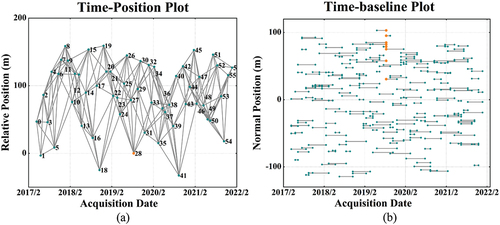
Figure 4. Map of subsidence rates in the LOS direction in Luoyang from 2017.04–2021.12. Major areas of subsidence are in grey boxes. S1, S2, S3 and S4 represent Xigong District, Jianxi District, Luolong District and Chanhe Hui Autonomous Region, respectively.
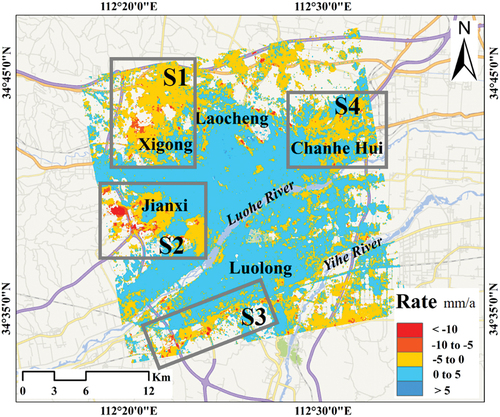
Figure 5. Time series of cumulative subsidence in Luoyang from 2017.04–2021.09. (the image acquired in 2019.03 is the reference image).
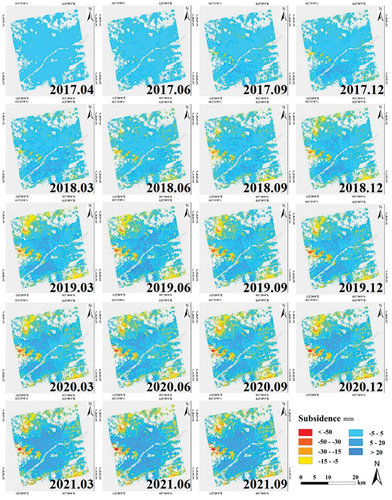
Figure 6. RMSE and coherence of deformation rate.
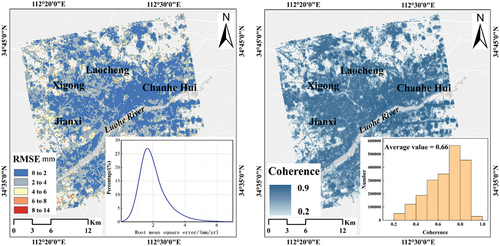
Figure 7. Land subsidence rate in the LOS direction and cumulative deformation of expressway. In the black box are the major subsidence areas. Green dots indicate the location of PS points.
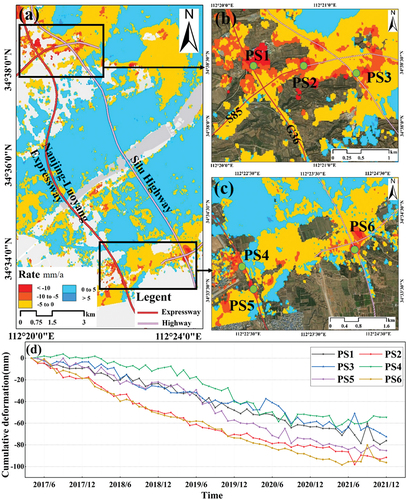
Figure 8. Subsidence along the railway line. The black box shows the major areas of subsidence. The black dashed line is the profile.
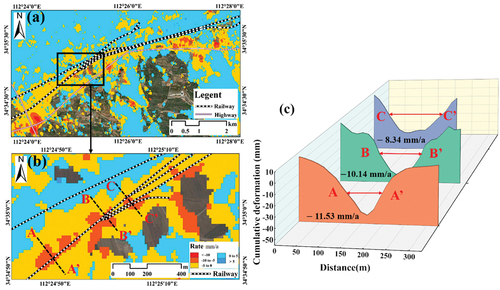
Table 2. Information of Luoyang metro under construction.
Figure 9. Subsidence along the metro line. (a) subsidence of Luoyang metro line, the black box is the areas of subsidence, the black dashed line is the profile, and green dots indicate the location of PS points. (b) PS point cumulative deformation curve. PS1, PS2 and PS3 correspond to the points in . (c) the profile deformation rate and cumulative deformation of AA’.
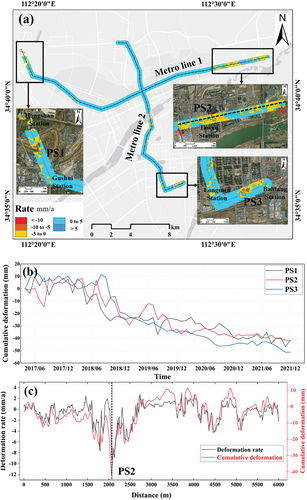
Figure 10. Subsidence of Luoyang Beijiao airport. (a) land subsidence around Luoyang Beijiao airport. Green dots indicate the location of PS points. (b) Google satellite optical images of the region. (c) time series of cumulative subsidence in Luoyang Beijiao airport. The red ellipse is the major subsidence area. (d) PS point cumulative deformation curve.
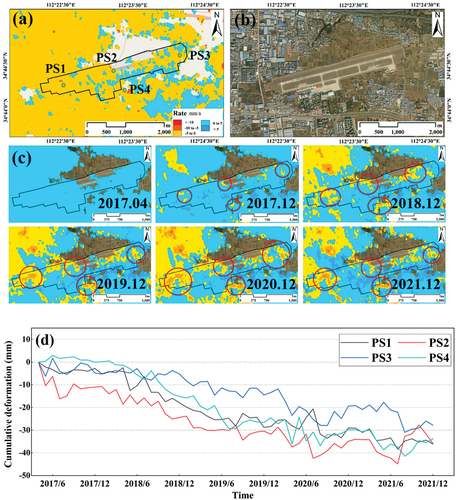
Figure 11. Subsidence of Luoyang Longmen high speed railway Station.
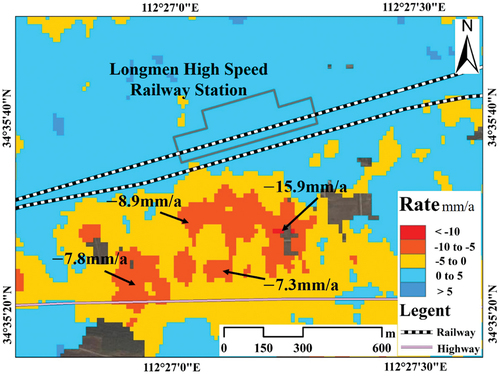
Figure 12. Distribution of ancient sites in Luoyang. The red polygon is the area of ancient sites.
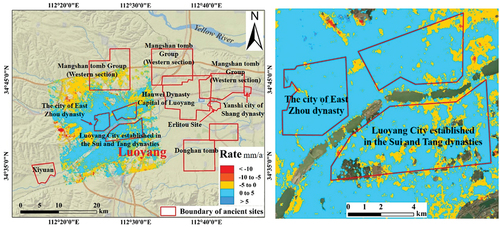
Figure 13. Distribution of major subsidence areas in Luoyang.
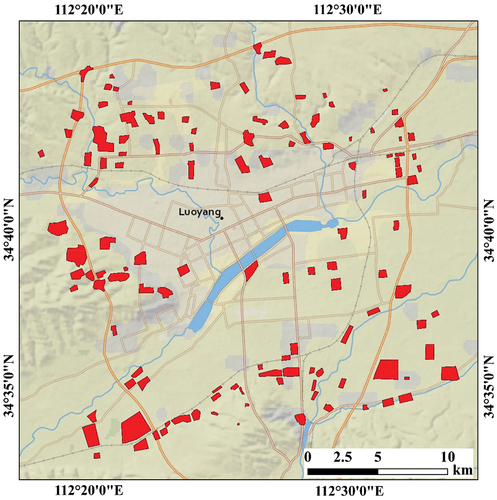
Figure 14. Distribution of land subsidence in industrial areas of Luoyang. Red polygons indicate industrial zone boundaries.
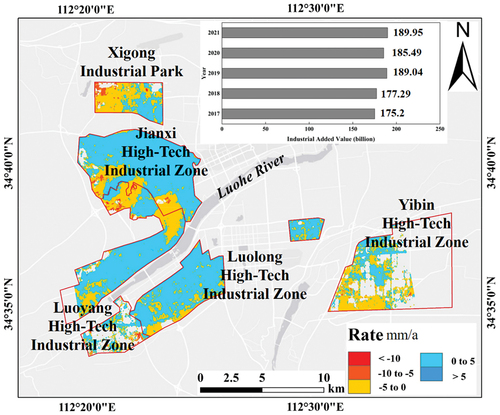
Figure 15. Total water resources, rainfall and proportional of water consumption in Luoyang.
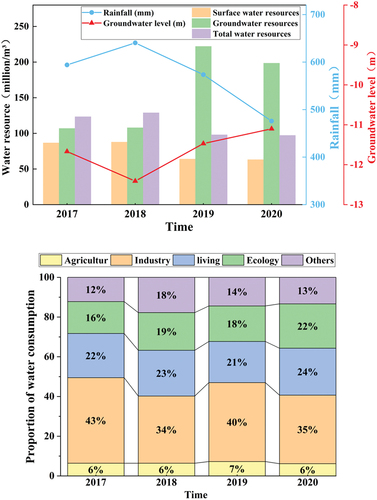
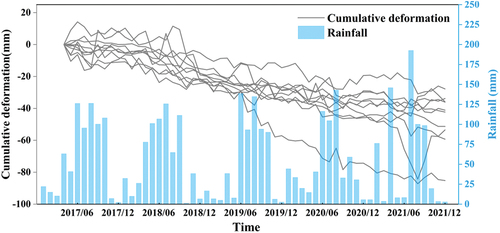
Figure 16. Comparison between subsidence time series and rainfall.
Data availability statement
Data incorporated in this research is available free through these webpages: Sentinel-1A (https://scihub.copernicus.eu/dhus/#/home), satellite precise orbit data (https://qc.sentinel1.eo.esa.int/aux_poeorb). 30 m SRTM DEM (http://dwtkns.com/srtm30m/). Optical data of Landsat satellites were obtained from Google Earth Pro software. Most of figures in this paper were drawn by Origin (version 2019b) and ArcMap (version 10.7) software.