
Figures & data
Figure 1. The distribution of shallow earthquakes with depths less than 50 km during 1963–2016 (Tim Pusat Studi Gempa Nasional-Citation2017(The 2017 PuSGeN), 2017) and the pre-seismic GPS data based on Triyoso et al (Citation2020, Citation2021, Citation2022). study and also the zones (I-VI) as mentioned by Shamim et al. (Citation2019). . the bathymetry data used in the tsunami simulation is based on geometric data provided by the General Bathymetric Charts of the Oceans (the GEBCO version 11.1, September 2008) and the digitised Nautical Chart of the Centre for Hydrographic Office (Pushidrosal) Indonesian Navy. The data are originally gridded on 1’arc (~1854 m) and have been resampled at 30’’ (~927) spatial resolution.
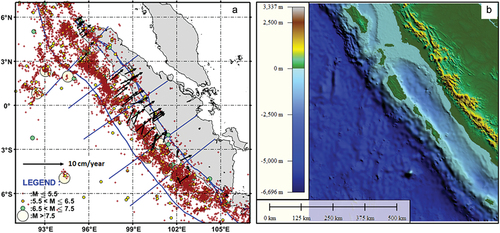
Table 1. The complete source parameter used in this study for tsunami simulation.
Figure 2. The result of DC from 1963 to 1999 (a). The result of DC from 1963 to 2003 (b). It appears that relatively high DC (positive δDC) characterises the area around M7.7 of the 2000 event. Therefore, based on (A), the DC map could reasonably describe high-strain loading around the southern part of the Sumatra subduction zone. Likewise, the DC map (B) could also reasonably describe high-strain loading around the northern part of the Sumatra subduction zone.
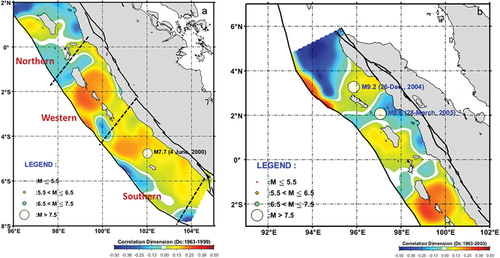
Figure 3. The result of DC from 1963 to 2004 in northern Sumatra (a). The boundary (black) shows the area of M8.6; refer to Triyoso and Sahara (Citation2021). The maximum shear strain rate is estimated based on the pre-seismic GPS data (b). The DC around the area before M8.6 of March 2005 is close to the mean value of Dc. To understand the phenomenon better, we estimate the maximum shear strain rate (SHmax-rate), as shown in (B), using the pre-seismic GPS data of Triyoso et al. (Citation2020). The area around M8.6 of March 2005 shows a high SHmax-rate. Triyoso and Sahara (Citation2021) support Pollitz et al’.s (2005) suggestion that this area is interpreted as a closed-to-mature place where the effect of stress transfer of M9.2 affect the time advance of the M8.6 event to rupture.
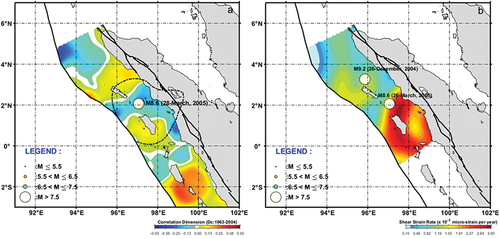
Figure 4. The result of DC from 1963 to 2009 in northern Sumatra (a). The maximum shear strain rate is estimated based on the pre-seismic GPS data in which the effect of December 26, 2004, and March 28, 2005 earthquakes are removed (b). The DC around the area before M7.8 of April 2010 is close to the mean value of Dc. Following the previous study by comparing the result of (B), it is suggested that stress accumulation around the area indicated by Triyoso and Sahara (Citation2021) is ruptured partially and followed by M7.8.
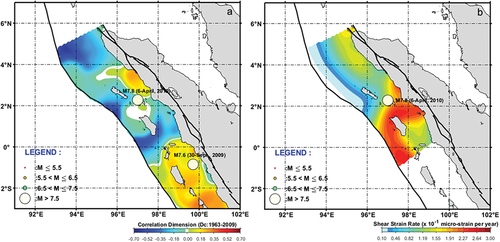
Figure 5. The result of DC was from 1963 to 2006 (a) and from 1963 to August 2009 (b) in southern Sumatra. Both results show that relatively high DC (positive δDC) characterises the area around M8.5 and M7.9 of the September 12, 2007 events and the M7.6 on September 30, 2009, and M7.8 on October 25, 2010.
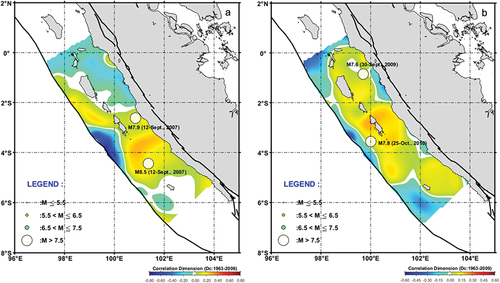
Figure 6. The cross-correlation of DC and the SHmax-rate (a). This overlaid with the historical earthquake and fault model of the 1797 and 1833 megathrust events (Natawidjaja et al., Citation2006). Following the finding of Konca et al. (Citation2008), we adjust the fault parameter model by referring to the 1797 fault model to estimate possible seismic and tsunami hazards. The fault parameter model and simulation of the forward model (Okada, 1985; Okada, Citation1992) co-seismic surface displacement with the slip of about 8 metres (b). The possible co-seismic slip is based on the maximum slip model in Natawidjaja et al. (Citation2006) and Borrero et al. (Citation2007). Other fault parameters, such as dip and rake, are based on the result of Shamim et al. (Citation2019).
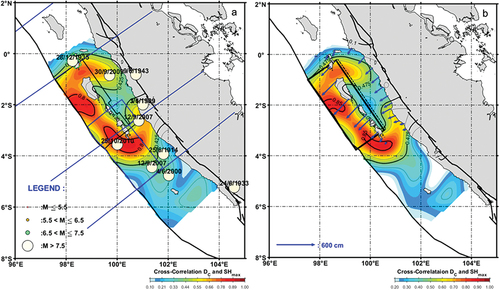
Figure 7. The estimated seismic hazard is expressed as the Peak ground Acceleration (g) at the base rock based on the defined fault parameter in this study (a). The possible high ground shaking of about ~0.65 g at the base rock at P2 and P3 is about 0.25 g. The observation points of N3, P5, P6, and S3 are about 0.05 g. The selected sites’ (P2, P3, N3, P5, P6, and S3) probabilistic seismic hazard function (PSHF) estimated (b). The PSHF curve of the total probability of an exceedance value of 10% of earthquake events in 50 years versus the PGA values is estimated. Following Triyoso et al. (Citation2020), Triyoso and Sahara’s (Citation2021), and Triyoso and Suwondo’s (Citation2022) studies, in this study’s probabilistic seismic hazard calculation, the maximum radius distance of about 100 km is used with a magnitude range of 6.0–9.0. N3 shows the highest PSHF among the six selected observation points.
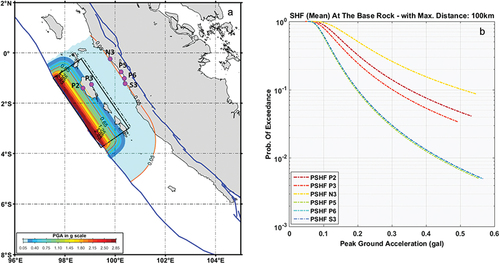
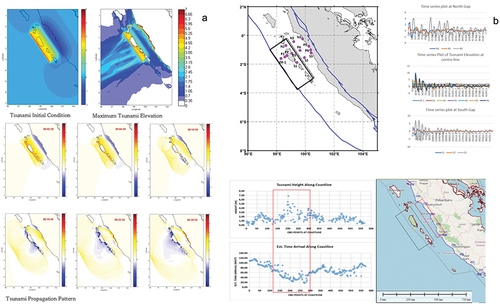
Figure 8. The initial condition and maximum tsunami height distribution show that the most affected areas are perpendicular to the source region (a). For example, the tsunami affecting the west coast of West Sumatra is coming from the offshore gap between Siberut and Banyak island and between Siberut and Sipora island, as well as a tsunami generated inside the basin Siberut and the main island of Sumatera. The time series and the scatter plot of tsunami height and arrival time along the coastline (b). It shows the areas perpendicular to the source region that had the highest tsunami height and shortest arrival time. The red rectangle in the left figure (b) and the right figure show the areas perpendicular to the source region (black rectangles in the right figure).
Data availability statement
The earthquake data utilised in this study is based on Public Domain Data from The 2017 PusGen (The 2017 PusGen, 2017). The selected data used is based on the magnitude of Mw ≥4.7 with a maximum depth of 50 km from 1963 to 2016. In addition, the historical catalogue is based on selected Mw ≥7.5 earthquake events from 1907 to 2010 (The 2017 PusGen, 2017) along the Sumatran subduction zone. The GPS data are based on Yusfania et al. (Citation2014), Khaerani et al.’s (2018), Triyoso et al. (Citation2020), Triyoso and Sahara’s (Citation2021), Triyoso et al. (Citation2021) and Triyoso et al. (Citation2022) studies. The geological data are based on Natawidjaja et al.’s (2004) and Konca et al. (Citation2008) works. The result of the six domains (zones I-VI) is based on Shamim et al. (Citation2019) research.