Figures & data
Figure 1. Groundwater around the World: A Geographical Synopsis. Boca Raton, Fla., CRC Press. Source: Margat and Van der Gun (Citation2013).
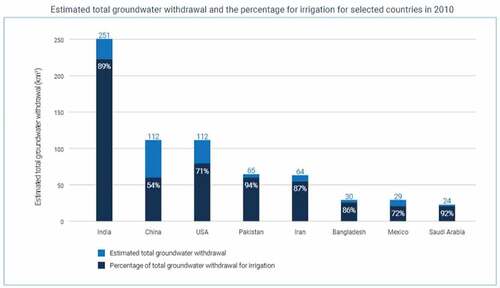
Figure 2. Geothermal Water Use: Requirements and Potential Effects. Australian Geothermal Energy Conference 2011, pp. 63–67. Source: Driscolland Middlemis (Citation2011).
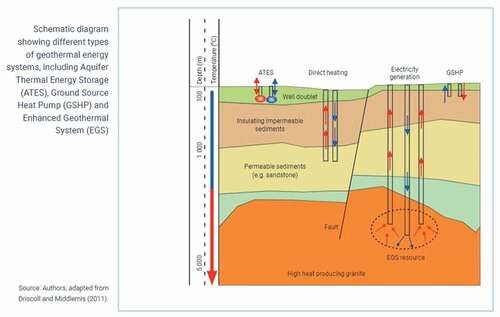
Figure 3. Transboundary Aquifers of the World [map]. Edition 2021. Scale 1 : 50 000 000. Delft, The Netherlands.Source: IGRAC (International Groundwater Resources Assessment Centre) (Citation2021).
![Figure 3. Transboundary Aquifers of the World [map]. Edition 2021. Scale 1 : 50 000 000. Delft, The Netherlands.Source: IGRAC (International Groundwater Resources Assessment Centre) (Citation2021).](/cms/asset/580b1d04-9299-462c-a9d4-ff572fd69a00/tlhb_a_2090867_uf0003_oc.jpg)