Figures & data
Figure 1. Schematic of the water supply system of Bontoc, Mountain Province.
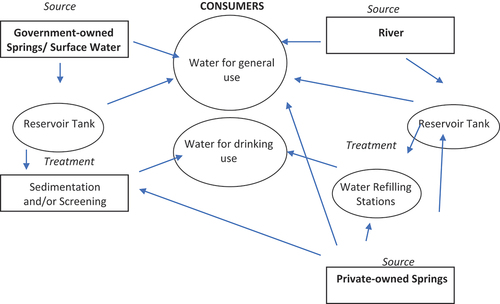
Table 1. Discharge from water sources (L/s).
Figure 2. Consumption patterns per category.
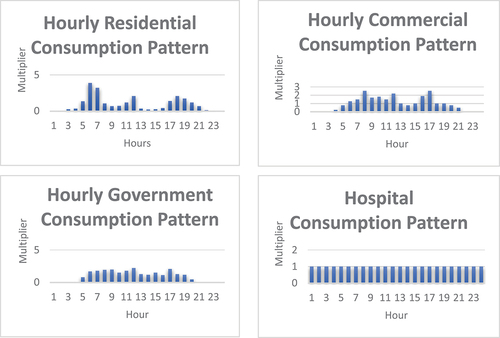
Table 2. Water demand per category.
Figure 3. Distribution network base map as of 2021.
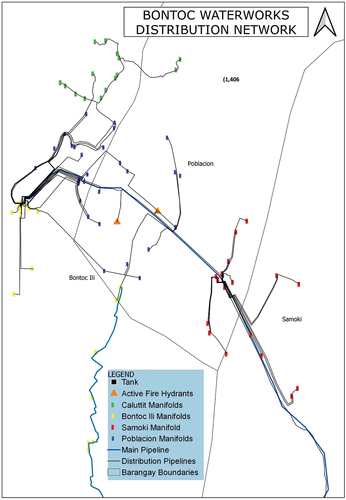
Figure 4. Control panels A and B.
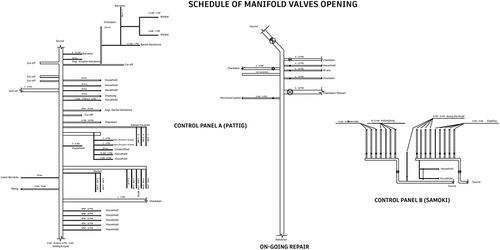
Table 3. Current water service hours.
Table 4. Manifolds and population per barangay.
Table 5. Tank dimensions.
Table 6. Pipe diameter and lengths.
Figure 5. Framework of the study.
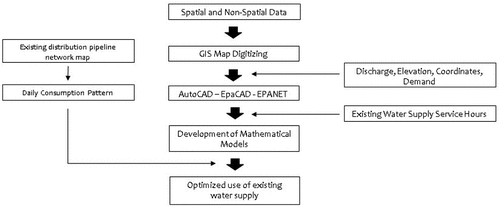
Figure 6. Process of GIS data conversion to EPANET.
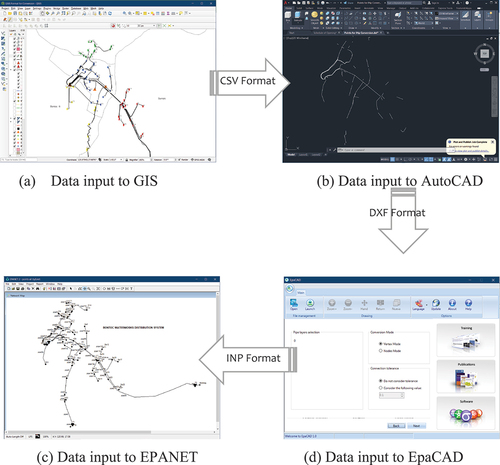
Figure 7. Waterworks distribution system elements imported into EPANET.
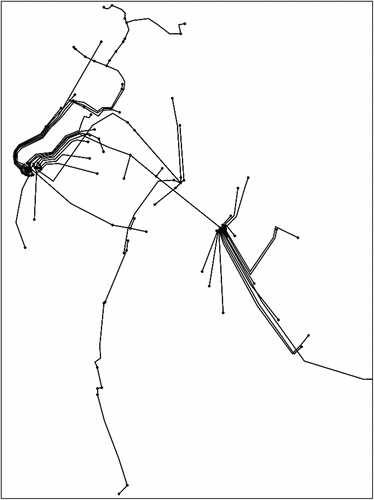
Figure 8. Contour plot.
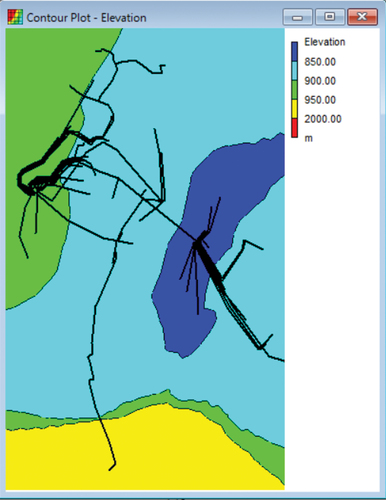
Figure 9. Elevation and pipe diameters.
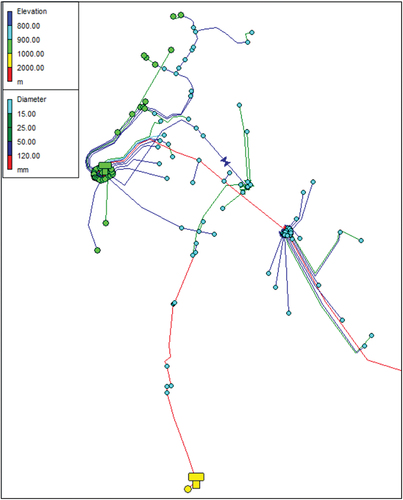
Figure 10. Pressure and velocity during peak demand.
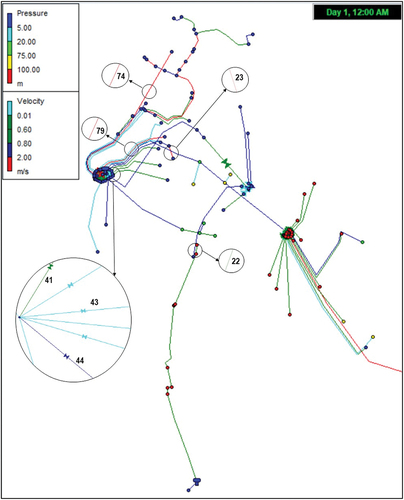
Table 7. Optimised number of taps to be supplied using Equation (1).
Table 8. Calculated warning discharges for water supply variation.
Figure 11. Schematic diagram of water service time distribution.
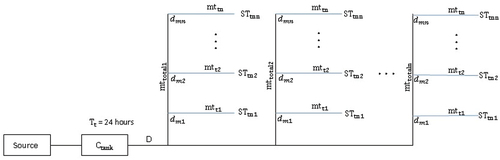
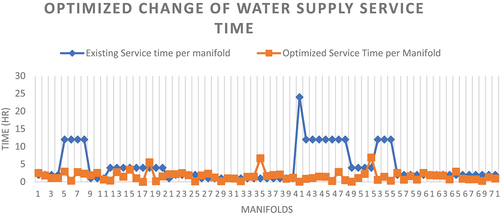
Figure 12. Time difference in the water service schedule between the existing and optimised values.
Data availability statement
The data that support the findings of this study are available from the corresponding author, E.B. Magwilang, upon reasonable request.