Figures & data
Table 1. Type I error rate of normality tests against independent Normal (2, 1) distribution, and convoluted Normal (2, 1) and Normal (0, 1) distributions with varying sample sizes
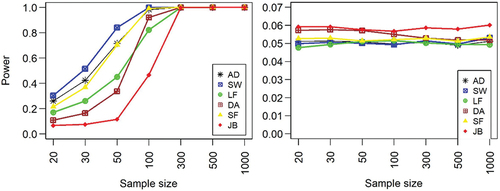
Figure 1. Power of normality tests against independent uniform (left panel) and convoluted uniform-normal distributions (right panel) with varying sample sizes.
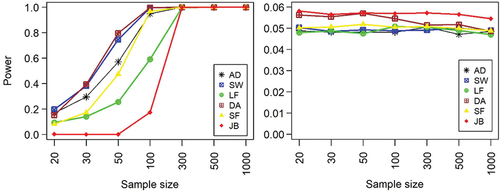
Figure 2. Power of normality tests against independent Student’s t (left panel) and convoluted Student’s t-normal distributions (right panel) with varying sample sizes.
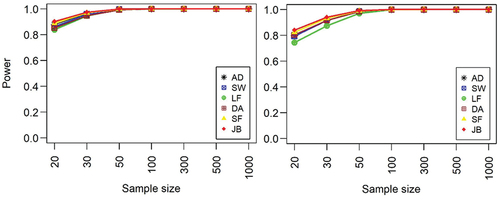
Figure 3. Power of normality tests against independent exponential (left panel) and convoluted exponential-normal distributions (right panel) with varying sample sizes.
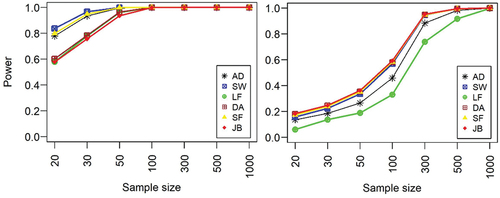
Figure 4. Power of normality tests against independent gamma (left panel) and convoluted gamma-normal distributions (right panel) with varying sample sizes.
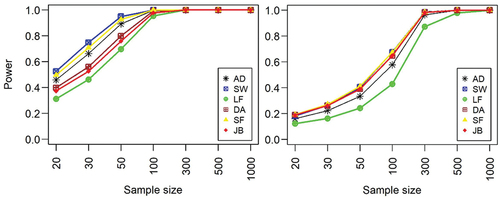
Figure 5. Power of normality tests against independent beta (left panel) and convoluted beta-normal distributions (right) with varying sample sizes.