
Figures & data
Figure 1. Plots of density (left) and hazard rate (right) functions of CTLW distribution.
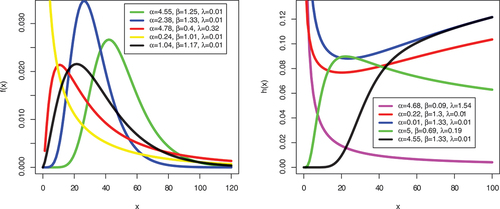
Figure 2. Plots of the density function of CTLF distribution.
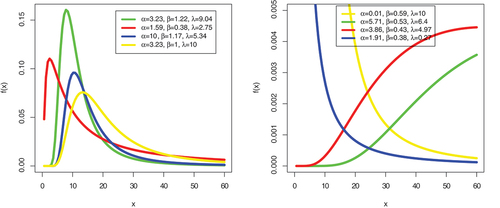
Figure 3. Plot of hazard rate function of CTLF distribution.
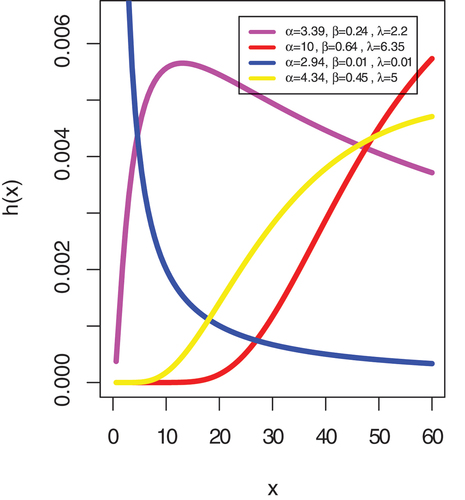
Figure 4. Plots of density function of CTLB distribution.
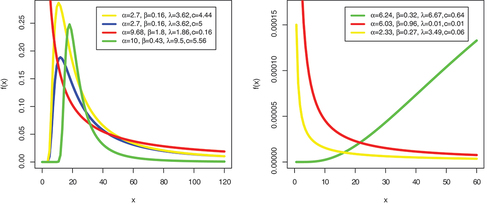
Figure 5. Plot of hazard rate function of CTLB distribution.
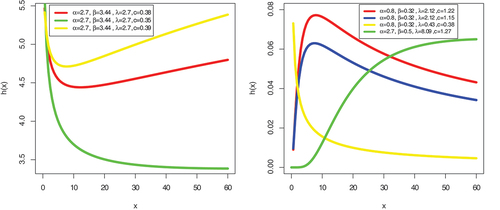
Figure 6. Plots of density functions of CTLCh distribution.
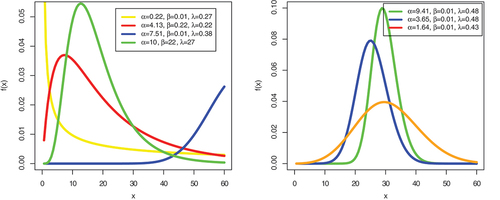
Figure 7. Plot of hazard rate function of CTLCh distribution.
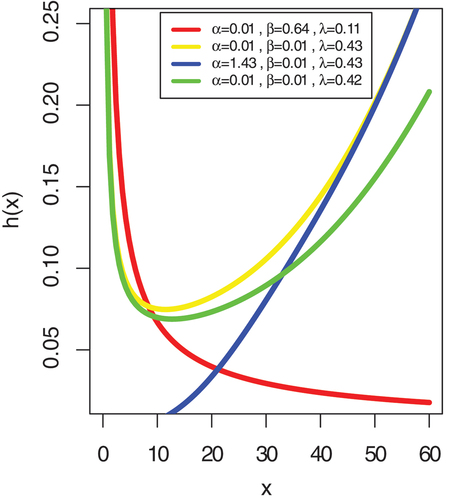
Figure 8. Plots of density (left) and hazard rate (right) functions of CTLCa distribution.
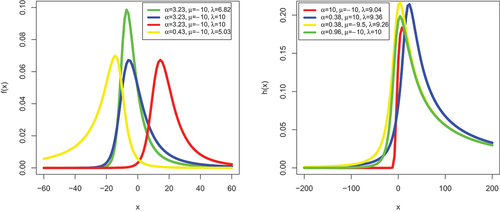
Table 1. Simulation results of AB, RMSE, and CP for CTLW distribution
Table 2. Data on survival times of lung cancer patients
Table 3. Parameter estimates and standard errors (in parentheses) for dataset 1
Table 4. Goodness-of-fit statistics and information Criteria for dataset 1
Figure 9. Estimated CDF plots of fitted distributions for Data 1.
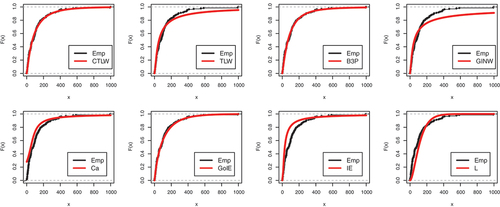
Table 5. Data on survival time of brain cancer patients
Table 6. Parameter estimates and standard errors (in parentheses) for dataset 2
Table 7. Goodness-of-fit statistics and information Criteria for dataset 2
Figure 10. Estimated CDF plot of fitted distribution for Data 2.
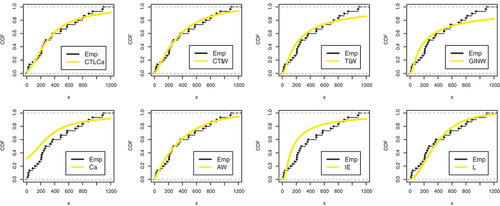
Figure 11. PDF Plots of the LCTLW distribution.
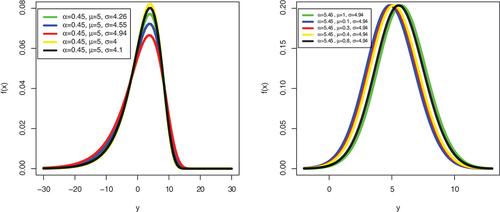
Table 8. The estimates of the regression parameters and goodness-of-fit statistics for the dataset
Figure 12. Cox-Snell residual plot of LCTLW regression model.
Table