
Figures & data
Figure 1. Numerical solution of example 1, with .
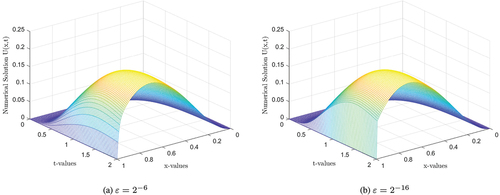
Figure 2. Numerical solution of example 2, with .
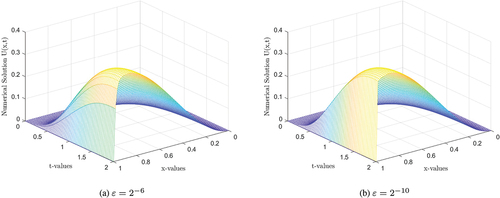
Figure 3. Log-log plot of maximum point-wise error 3a for Example 1 and 3b for Example 2.
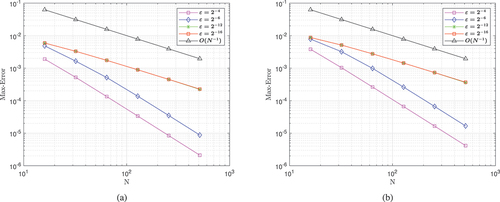
Table 1. Example 1: Maximum point-wise error of the numerical solution
Table 2. Example 2: Maximum point-wise error of the numerical solution when N = M
Table 3. Maximum absolute error and rate of convergence of the scheme in temporal direction
Table 4. Comparison of uniform error and order of convergence for Example 1 at with Gowrisankar and Natesan (Citation2017)