
Figures & data
Figure 1. 3D view of numerical solution for example 4.1 with .
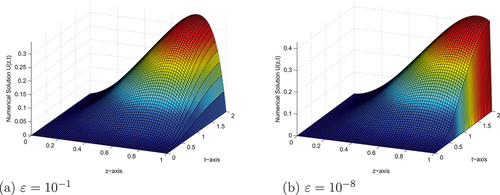
Figure 2. (a), (b) and (c) effect of the and η on the behaviour of the solution with layer formation when
, respectively.
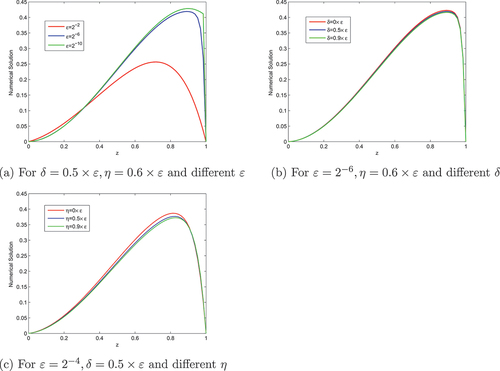
Figure 3. Example 4.1 Log-Log scale plot of the maximum absolute error for different values of ɛ.
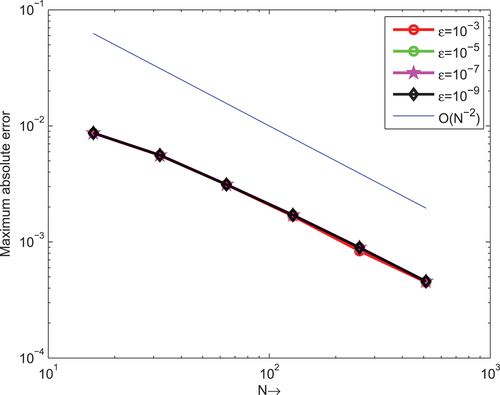
Table 1. and
for example 4.1 using the proposed method and results in (Sahu & Mohapatra, Citation2021) with
Table 2. and
for example 4.1 using the proposed method with
Data availability statement
No data were used to support the study.