
Figures & data
Figure 1. Plots for the density (a) and hazard rate (b) functions of the SEBXII distribution.
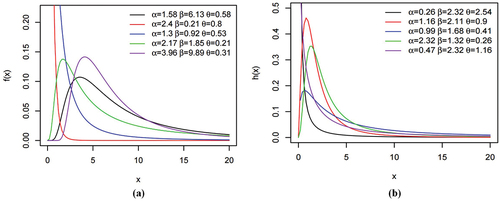
Table 1. First four moments, σ, CV, CS, and CK of the SEBXII distribution
Figure 2. VaR plots for SEBXII distribution.
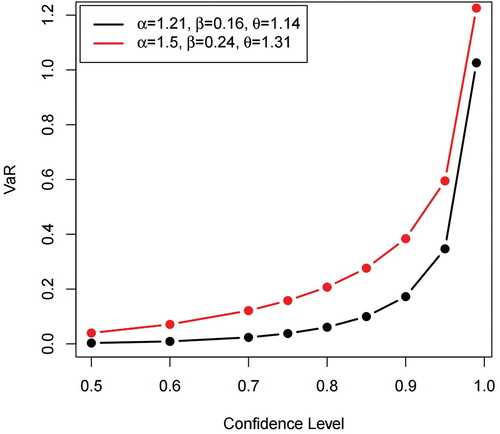
Figure 3. TVaR plots for SEBXII distribution.
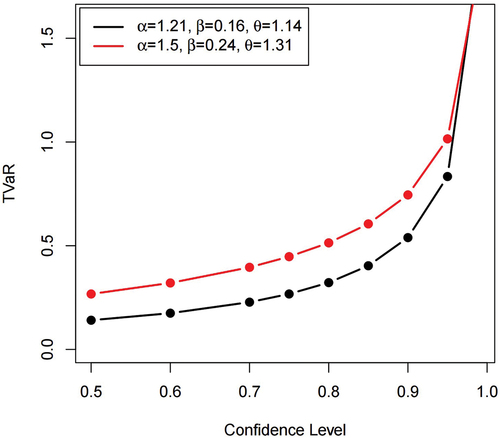
Figure 4. TV plots for SEBXII distribution.
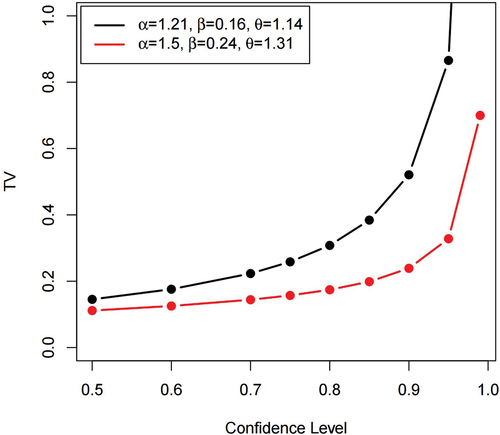
Table 2. Simulation results of actuarial measures for n = 200
Table 3. Mean and variance of aggregate loss of SEBXII under the Poisson distribution with λ = 5
Table 4. Simulation results of AB and MSE for α = 1.02, β = 0.53, θ = 2.23
Table 5. Simulation results of AB and MSE for α = 0.65, β = 2.46, θ = 0.82
Figure 5. Box plot, histogram, violin plot, and kernel density of the automobile collision data.
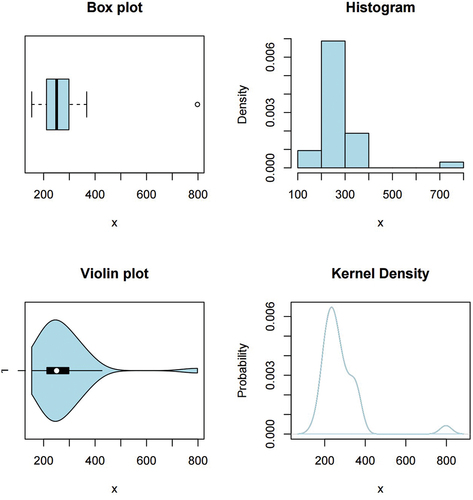
Figure 6. TTT plot of the automobile collision dataset.
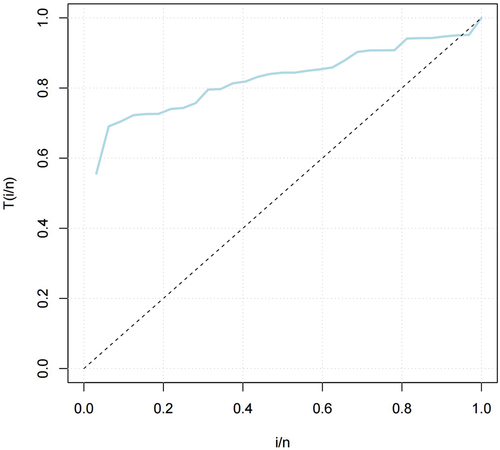
Table 6. Descriptive statistics of automobile collision data
Table 7. Mles, SEs, information criteria, goodness-of-fit measures for automobile collision data
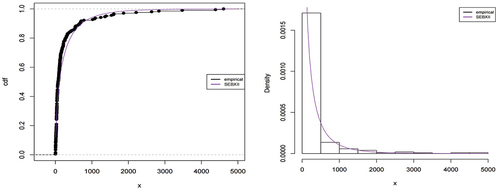
Figure 7. Empirical, fitted CDF and density of the SEBXII distribution for automobile collision dataset.
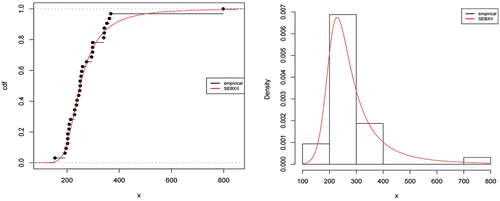
Figure 8. Box plot, histogram, violin plot, and kernel density of the catastrophe data.
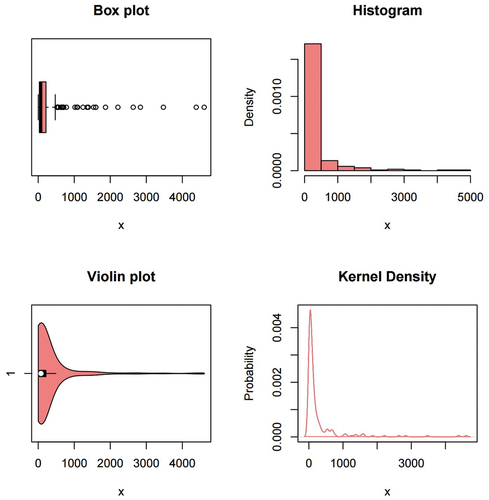
Table 8. Descriptive statistics of catastrophe data
Figure 9. TTT plot of the catastrophe dataset.
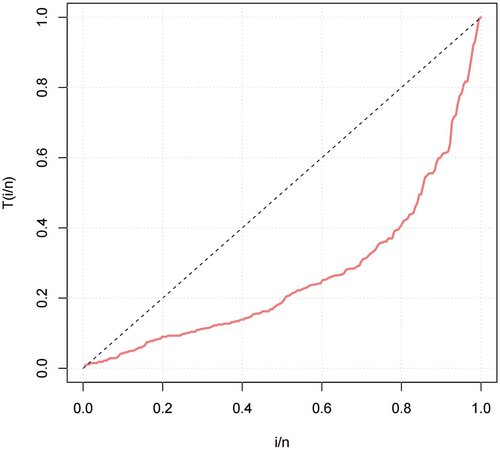
Table 9. Mles, SEs, information criteria, goodness-of-fit measures for catastrophe data
Figure 10. Empirical, fitted CDF and density of the SEBXII distribution for catastrophe dataset.
Data availability statement
The data that support the findings of this study are available in the CASdatasets and insuranceData packages of the R software.