
Figures & data
Table 1. Explanations of parameters stated in the model
Table 2. Definitions of state variables
Figure 1. Flow chart of negative attitude employees.
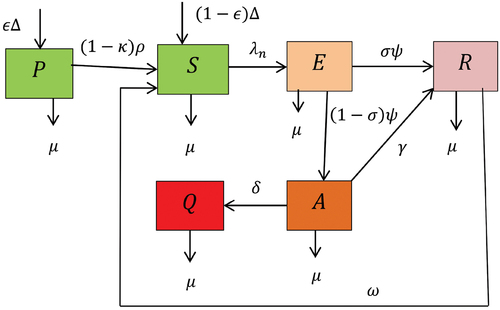
Figure 2. β vs Reff.
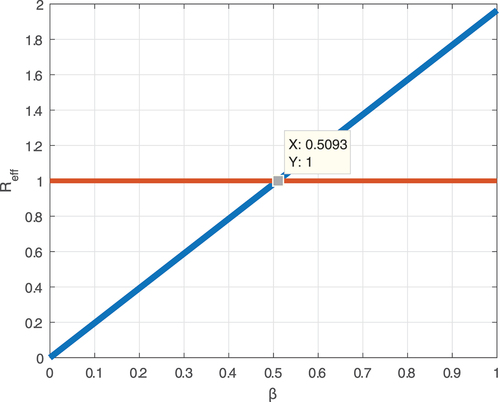
Figure 3. Ε vs Reff.
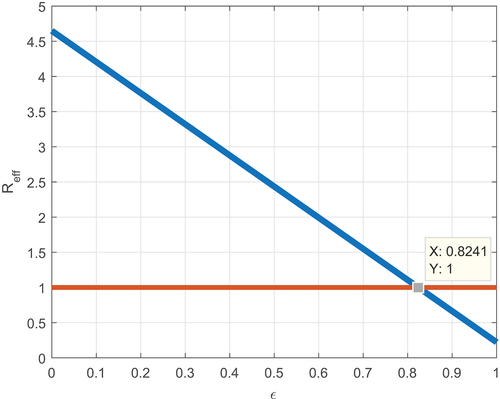
Figure 4. γ vs Reff.
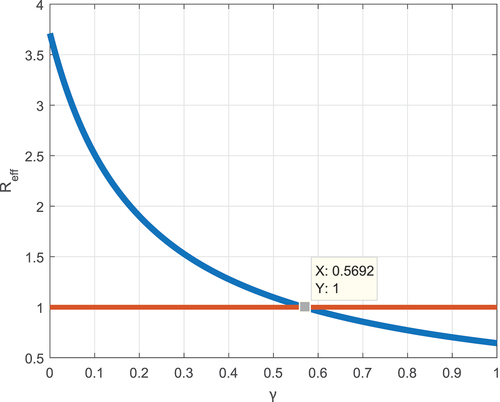
Figure 5. κ vs Reff.
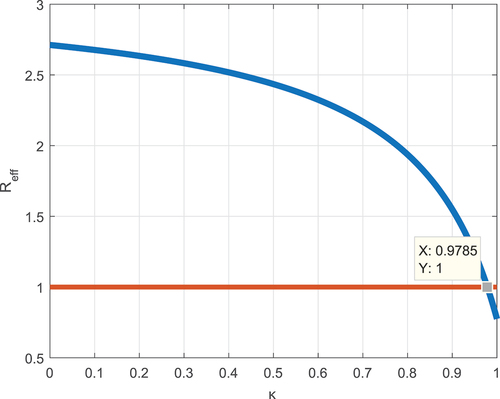
Figure 6. The time series evaluation of system(8) by varying the initial condition and .
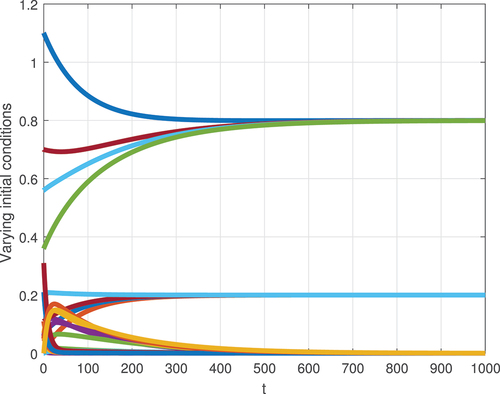
Figure 7. The time series evaluation of system Equation8(8)
(8) by varying the initial condition and
.
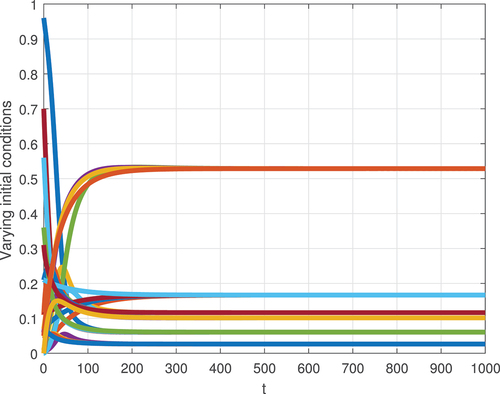
Figure 8. The impact of β on the .
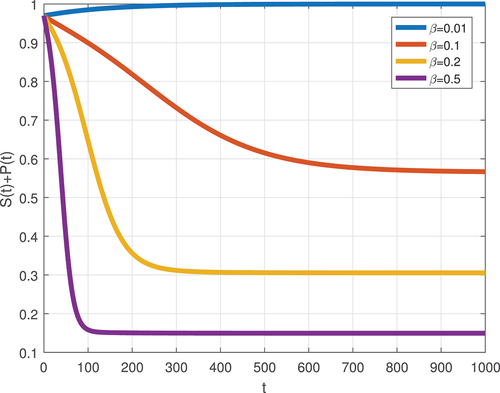
Figure 9. The impact of β on the .
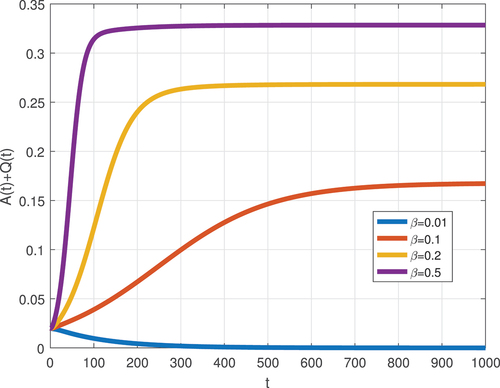
Figure 10. The impact of ϵ on the P(t).
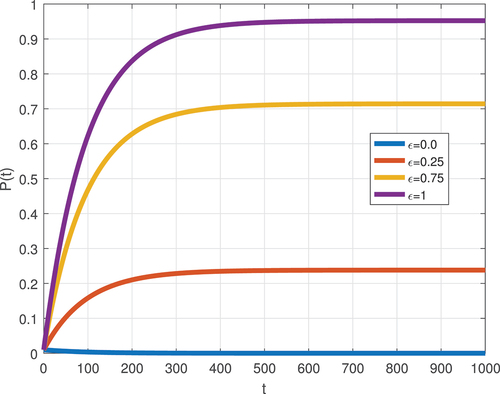
Figure 11. The impact of ϵ on the .
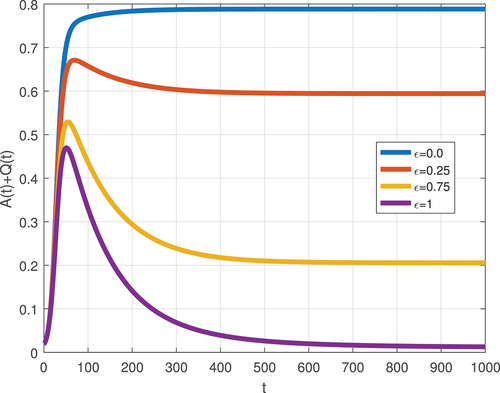
Figure 12. The impact of κ on the P(t).
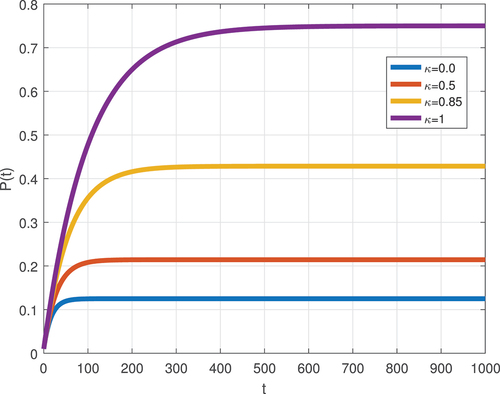
Figure 13. The impact of κ on the .
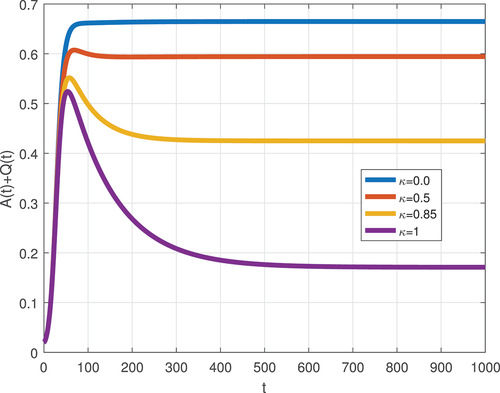
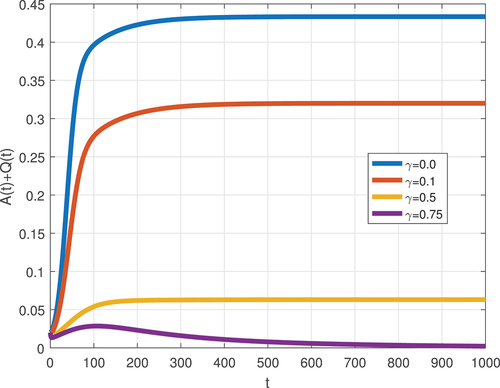
Figure 14. The impact of γ on .
Reference_.bib
Download Bibliographical Database File (16.5 KB)Data availability statement
All data generated or analyzed in the process of this study are incorporated in this published paper.