
Figures & data
Table 1. Best parameters of the proposed MDS plan for TGHLD with = 1.5
Table 2. Best parameters of the proposed MDS plan for TGHLD with = 2
Table 3. Best parameters of the proposed MDS plan for TGHLD with = 2.5
Figure 1. Histogram superimposed empirical density plots and Q-Q plot of the fitted TGHLD for cycles to failure for electrical appliances data.
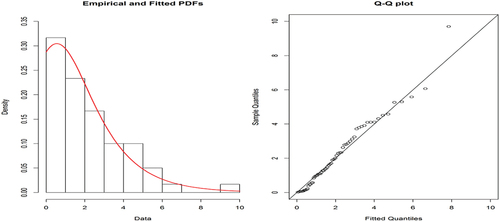
Table 4. Best parameters of the proposed MDS plan for TGHLD with = 0.5749
Table 5. ASN values of the proposed MDS plan, repetitive sampling plan (RSP) and single sampling plan (SSP) for the TGHLD when
Table 6. ASN values of the proposed MDS plan, repetitive sampling plan (RSP) and single sampling plan (SSP) for the TGHLD when
Figure 2. OC curves for comparison between MDS and SSP.
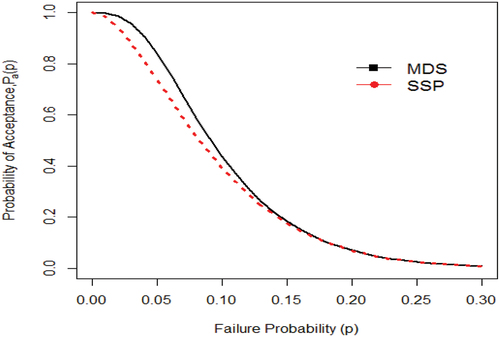
Figure 3. OC curves for comparison between MDS, RSP and SSP.
