
Figures & data
Table 1. Dutch meadow bird scheme measures.
Table 2. Technical coefficients that are the same for all farms.
Table 3. Three representative farms.
Figure 1. Overview model simulations.
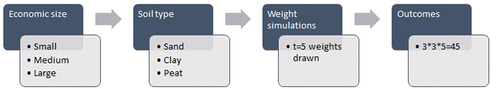
Figure 2. Role of the weight for agri-environmental services (base model). (a) Farms on sand and clay, (b) Farms on peat.
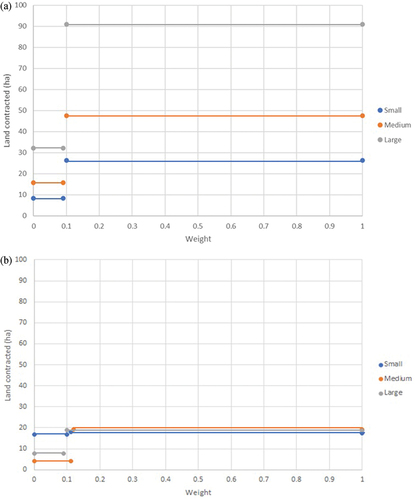
Table 4. Nitrogen allowance.
Table 5. Outcomes scenarios versus base model, for soil types sand and clay (shown for weights .
Table 6. Outcomes scenarios versus base model, for peat (shown for weights .
Table A1. Base Scenario for farms on sand and clay, for weights .
Table A2. Base Scenario for farms on sand and clay, for weights .
Table A3. Scenario I No derogation for farms on sand and clay (all weights).
Table A4. Scenario II Low-protein feeding for farms on sand and clay (all weights).
Table A5. Base scenario for farms on peat, for weights .
Table A6. Base scenario for farms on peat, for weights .
Table A7. Base scenario for farms on peat, for weights .
Table A8. Base scenario for farms on peat, for weights .
Table A9. Scenario I no derogation for farms on Peat (all weights).
Table A10. Scenario II low-protein feeding for farms on peat (all weights).