Figures & data
Figure 1. Characteristics of the fruit value chain considered within this study.
Figure 2. Overview of searched media and keywords for digital tool review.
Table 1. Stakeholder group descriptions (n = 4).
Table 2. Deductive categories for the interview result assessment.
Table 3. Definitions of commonalities, partial commonalities, and discrepancies based on comparisons across dataset quartile groupings.
Table 4. Stages of development per part of the value chain.
Table 5. Tools that are hirable services per part of the value chain, function category, and function (n = 10).
Table 6. Intended agricultural sector of use (n = 214).
Table 7. Usability of tools per part of the value chain (n = 214).
Table 8. Form of connectivity of tools per part of the value chain (n = 127).
Table 9. Capabilities of tools (n = 127).
Table 10. Tools available in the German language per part of the value chain and per function (n = 69).
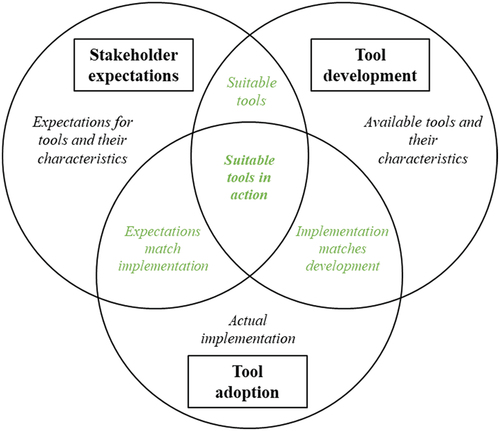
Figure 3. Implications of commonalities and discrepancies between stakeholder expectations, tool development, and tool adoption.