Figures & data
Table 1. Data sources used to describe different points of focus in the analysis.
Figure 1. The methodology of interdisciplinary research framework (Tobi & Kampen, Citation2018).
Table 2. Schematic representation of an adapted version of “the methodology of interdisciplinary research framework” (Tobi & Kampen, Citation2018), the actors involved in each stage, and their discipline, nationality and organization. Based upon their involvement in different task, we identify an “design task-group” represented in the dotted square, an “implementation task-group” represented in the dot-striped square, and an “analysis task-group” represented in the striped square.
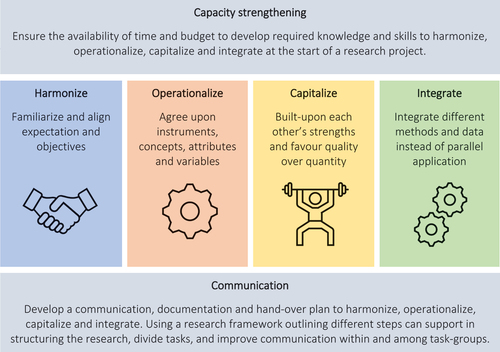
Figure 2. Foundations of complex team effectiveness.